GBP/JPY technical analysis: Locates foothold, stalling sell-off at 100-day SMA

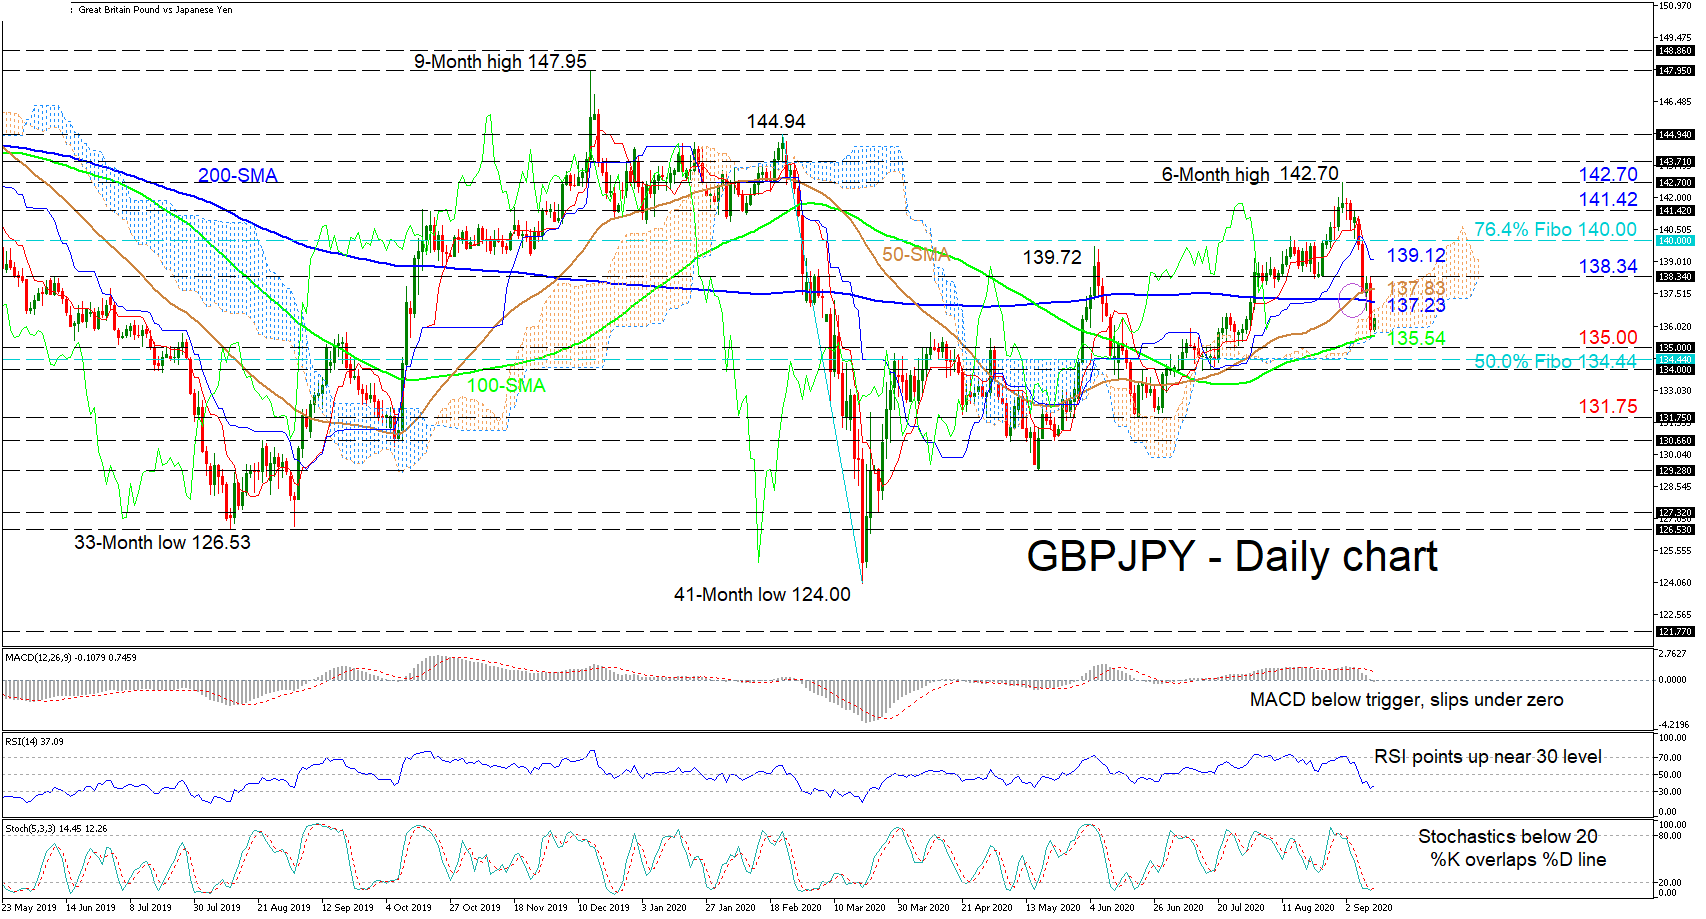
GBPJPY has discovered strong support from the 100-day simple moving average (SMA) of 135.54, located at the Ichimoku cloud’s lower boundary. The falling Ichimoku lines are backing the plunge in the price, while the 50- and 100-day SMAs aim to restore the pair in positive ground.
The short-term oscillators are also displaying conflicting signals in momentum, hinting that price may shift into a sideways market for a while. The MACD is extending its dip under its red signal line, below the zero mark, while the RSI in bearish territory, is improving slightly ahead of the 30 level. The stochastics %K line has pushed above the %D line in the oversold region but has yet to confirm bullish tendencies in the price.
If price acquires traction off the 100-day SMA at 135.54, heavy resistance may commence from the 200-day SMA at 137.23 and the 50-day SMA at 137.83 overhead, prior to the 138.34 neighbouring high. Successfully surpassing these obstacles, the blue Kijun-sen line at 139.12 may hinder the price from reaching the 140.00 handle, which happens to be the 76.4% Fibonacci retracement of the down leg from 144.94 to 124.00. If buying interest persists, the pair may meet the 141.42 high, before revisiting the 6-month peak of 142.70.
Otherwise, if sellers manage to penetrate beneath the cloud’s lower frontier at 135.54, early limitations may develop from a key border at the 135.00 mark. Dipping past this, the support section from the 50.0% Fibo of 134.44 until the low of 134.00 may attempt to dismiss the decline. If further losses unfold, the price may zone in on the 131.75 trough from June 22.
Summarizing, it appears a stronger neutral tone is taking shape in the short-to-medium term picture. A break above 138.34 or below 135.00 may spark the next price development.
Author

Anthony Charalambous joined XM in 2019 and specializes in preparing daily technical analysis, using his years of trading experience to provide detailed forecasting for all major asset classes such as forex, indices, commodities and equities.


