Technical analysis: EUR/USD challenges floor of 2-month trading range

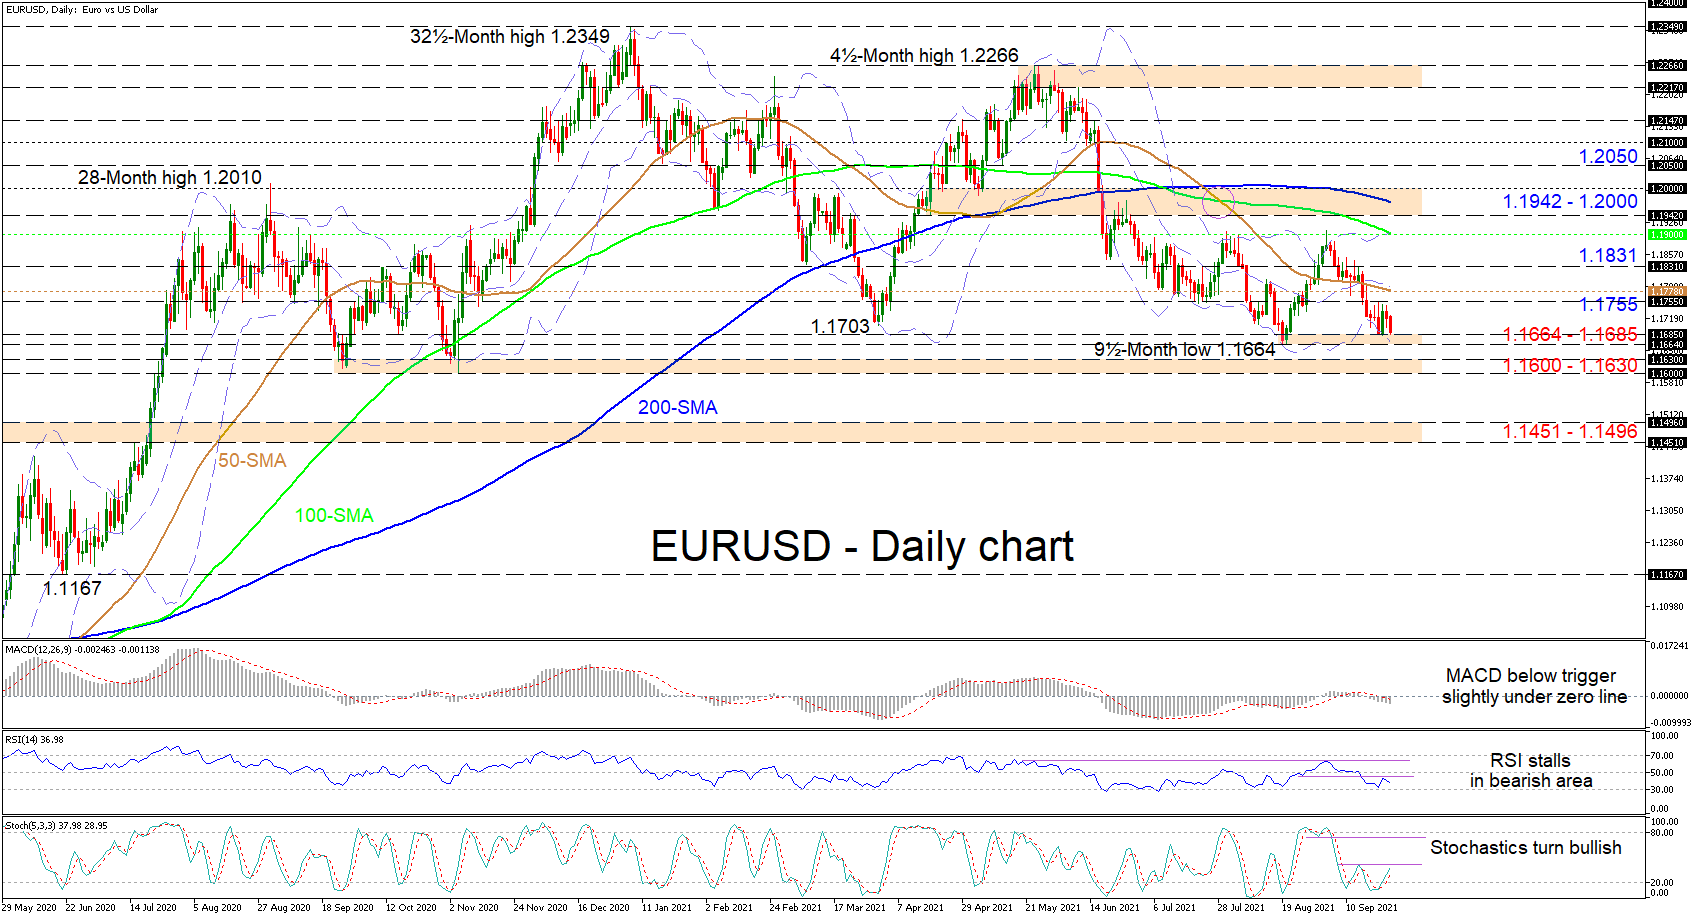
EURUSD remains skewed to the downside with sellers looking ready to retest the nine-and-a-half-month trough of 1.1664, which has managed to deny downward forces from snowballing. The short-term bearish tone in the pair is also being endorsed by the slight dip in the simple moving averages (SMAs).
At the moment the short-term oscillators are transmitting conflicting messages in directional momentum. The MACD, not too far beneath the zero threshold, is falling below its red trigger line, while the RSI is declining in bearish territory. On the other hand, the bullish stochastic oscillator has yet to confirm any waning in positive price action in the pair.
If sellers remain in the driver’s seat, initial downside deterrence could be met from the immediate base of 1.1664-1.1685 of the two-month sideways market. However, if the bears drive the price underneath the lower Bollinger band, residing within the mentioned support base, they may then encounter the foundation of the positive structure of 1.1600-1.1630, which has held since late September of 2020. Should this critical boundary break down too, bearish forces may then target the 1.1451-1.1496 support border.
Otherwise, if buying interest increases, preliminary resistance could develop from the 1.1755 nearby high and the 50-day SMA overhead at 1.1778. Overstepping the mid-Bollinger band around 1.1778, upside limitations from the 1.1831 obstacle may attempt to delay buyers from challenging the 100-day SMA at 1.1900, currently in-line with the peaks of the consolidation period. From here, in order to clearly bolster the upside momentum and head for the 1.2050 barrier, buyers would need to conquer the reinforced resistance section of 1.1942-1.2000.
Summarizing, in the short-term timeframe, EURUSD is exhibiting a neutral-to-bearish bias. A break below the 1.16000 handle could repower negative tendencies, while a shift above 1.1900 could see the pair regain a positive appeal.
Author

Anthony Charalambous joined XM in 2019 and specializes in preparing daily technical analysis, using his years of trading experience to provide detailed forecasting for all major asset classes such as forex, indices, commodities and equities.


