|

Technical analysis : Will the cotton price retreat continue?

Recommendation for cotton: Sell

Sell Stop: Below 81.53.

Stop Loss: Above 85.36.

RSI: Neutral.

MACD: Sell.

Donchian Channel: Neutral.

MA(200): Buy.

Fractals: Sell.

Parabolic SAR: Sell.

Chart analysis
Chart

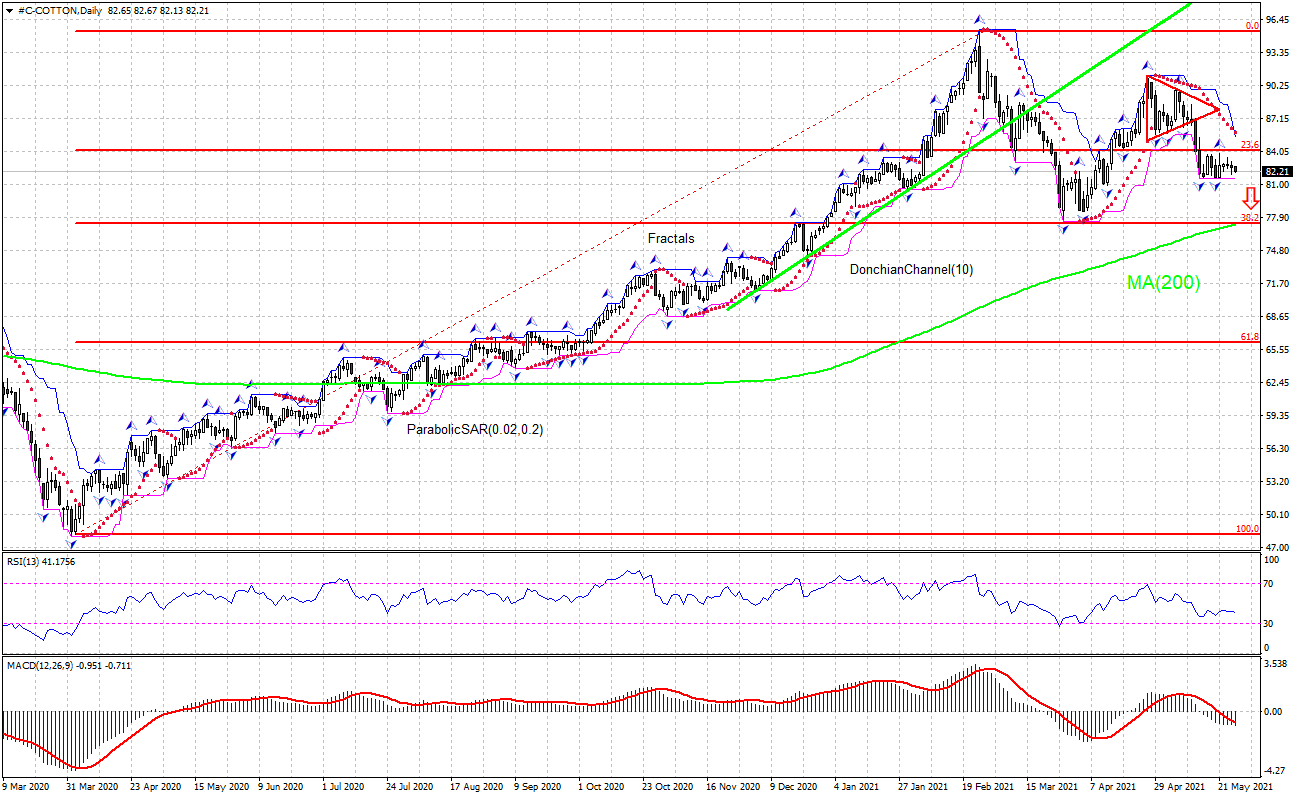
The #C-COTTON technical analysis of the price chart in the daily timeframe shows #C-COTTON, Daily has breached below the Fibonacci 23.6 support level above the 200-day moving average MA(200) which is rising. We believe the bearish momentum will continue after the price breaches below the lower Donchian boundary at 81.53. This level can be used as an entry point for placing a pending order to sell. The stop loss can be placed above 85.36. After placing the pending order the stop loss is to be moved every day to the next fractal high, following Parabolic signals. Thus, we are changing the expected profit/loss ratio to the breakeven point. If the price meets the stop-loss level (85.36) without reaching the order (81.53) we recommend cancelling the order: the market sustains internal changes which were not taken into account.

Fundamental analysis

Rainy weather in Texas improved cotton-growing conditions. Will the cotton price retreat continue? Rainfall events over the last 30 days in Texas improved soil moisture levels for drought-stricken parts of the state, according to Texas A&M AgriLife Extension Service reports. Texas produces more cotton than any other state in the United States - approximately 25% of the country's cotton crop on more than 6 million acres. Drought was a major concern for growers in western parts of the state, including the South Plains and Panhandle. Many acres in those areas were a dry plant. Rainy weather over the past several weeks has changed soil moisture conditions and improved crop outlooks. Improved supply prospects are bullish for cotton price.


Want to get more free analytics? Open Demo Account now to get daily news and analytical materials.


Want to get more free analytics? Open Demo Account now to get daily news and analytical materials.

Author

Dmitry  Lukashov

Dmitry Lukashov

IFC Markets

Dimtry Lukashov is the senior analyst of IFC Markets. He started his professional career in the financial market as a trader interested in stocks and obligations.


More from Dmitry Lukashov
Share:

Editor's Picks

GBP/USD hits multi-week tops around 1.3560

GBP/USD gathers fresh steam and advances to new three-month peaks near the 1.3560 zone on Friday. Cable’s sharp move higher comes after three daily drops in a row and follows the increasing selling pressure hurting the Greenback.

EUR/USD pops to fresh two-month highs, targets 1.1600

EUR/USD advances markedly, revisiting the upper 1.1500s for the first time since mid-June. The pair’s sharp uptick comes on the back of a strong retracement in the US Dollar amid BoJ intervention chatter and despite steady uncertainty in the Middle East.

Gold picks up pace, approaches $4,400

Gold rebounds toward the $4,400 mark per troy ounce on Friday, reversing the previous day’s pullback. The precious metal’s recovery comes as fresh and intense weakness keep weighing on the US Dollar, while traders keep assessing easing expectations of an imminent Fed interest rate hike and the situation from the Middle East.

Pi Network Price Forecast: PI extends consolidation as bulls eye $0.10
Pi Network (PI) price holds steady on Friday, maintaining a consolidating tone for three consecutive days. Mild retail strength in the PI token remains stable, with Open Interest above $9 million, while social buzz eases. PI token’s technical outlook is mixed, as bearish momentum wanes to neutral, with bulls eyeing the $0.1000 psychological level.
 Weekly focus: Some relief in US inflation concerns

Actual inflation data for July came out as expected with a 0.1% m/m increase in headline CPI and 0.2% excluding food and energy. Annual headline inflation remains too high at 3.4% and means that wage earners are experiencing stagnating spending power at best, and core inflation is a bit higher than the inflation target of two percent would suggest.

Why is Crude Oil priced for a reopening the ships haven't made?
Fourteen vessels crossed the Strait of Hormuz on Tuesday. Before the war, the count ran near 120 a day. In the sessions since the waterway was publicly declared open, Brent has drifted back to $87 and West Texas Intermediate (WTI) to $81, both a little lower again on Wednesday, with daily momentum on each unwound from the top of its range in late July to the low twenties now.














