Technical analysis: Will the Corn price continue retreating?

Recommendation for corn: Sell
Sell Stop: Below 514.
Stop Loss: Above 557.3 .
| Indicator | Signal |
| RSI | Neutral |
| MACD | Sell |
| Donchian Channel | Neutral |
| MA(200) | Sell |
| Fractals | Neutral |
| Parabolic SAR | Sell |
Chart analysis
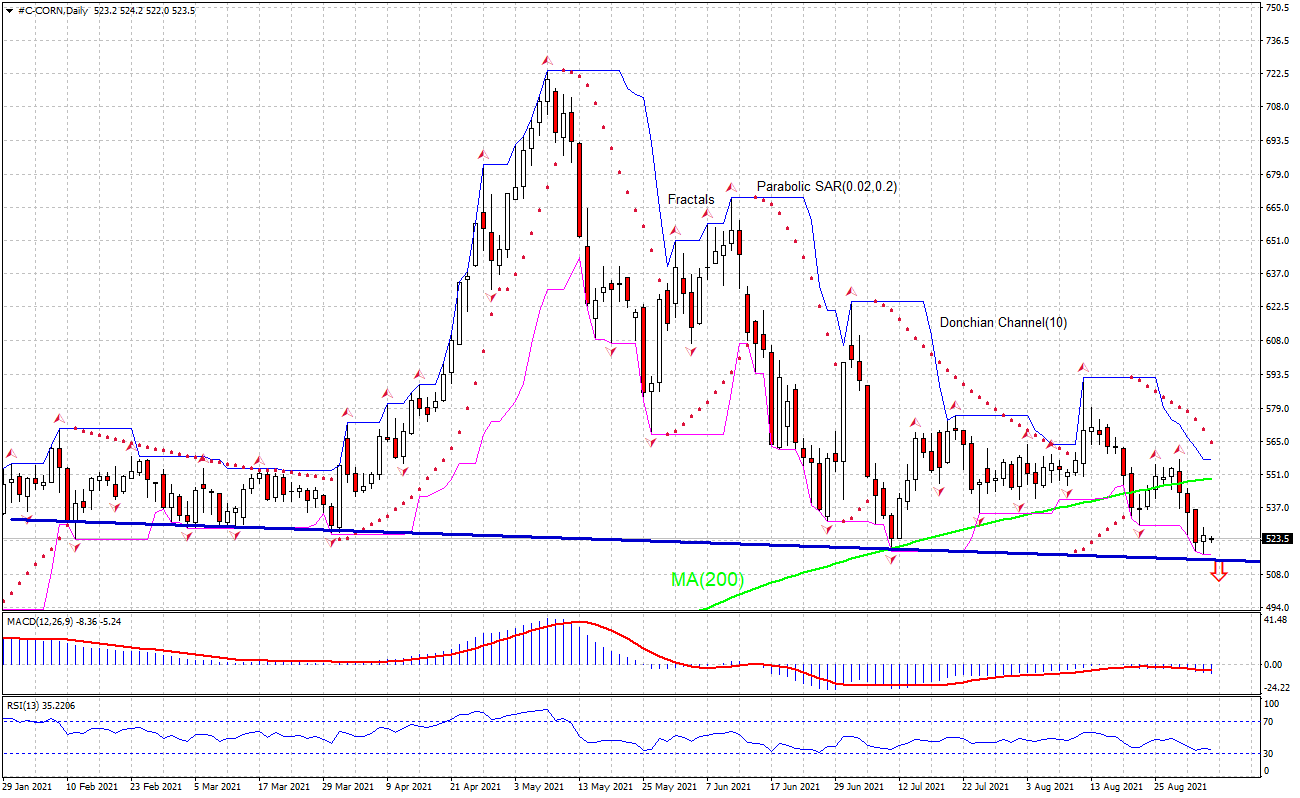
The #C-CORN technical analysis of the price chart in daily timeframe shows #C-CORN,D1 is retracing up toward the 200-day moving average MA(200), which is rising itself. We believe the bearish momentum will continue as the price breaches below the lower Donchian boundary at 514. A pending order to sell can be placed below that level. The stop loss can be placed above 557.3. After placing the order, the stop loss is to be moved every day to the next fractal high, following Parabolic signals. Thus, we are changing the expected profit/loss ratio to the breakeven point. If the price meets the stop loss level without reaching the order, we recommend cancelling the order: the market has undergone internal changes which were not taken into account.
Fundamental analysis
Traders expect China’s US corn purchases will miss forecasts while its domestic crop is expected to rise. Will the CORN price continue retreating?
Analysts are concerned China’s US corn purchases in 2021-22 may come up short of forecasts in light of China’s absence as a buyer since mid-May and its canceling of roughly 26 million bushels (mbu) of 2020-21 purchases in recent weeks. So far unshipped sales heading into the 2021-22 crop year are on order in the amount of 480 mbu. Additionally, the 2021-22 China’s domestic production is currently estimated to be up 7.3 million ton (MT), while the increase in corn use is projected at 5 MT. Expectations of lower Chinese corn imports and higher domestic supply are bearish for corn price. Reports that Russia and Ukraine corn crop is projected 11 MT higher this year with over 90% of that increase headed for the export market add to downside risks for #C-CORN.
Want to get more free analytics? Open Demo Account now to get daily news and analytical materials.
Want to get more free analytics? Open Demo Account now to get daily news and analytical materials.
Author

Dmitry Lukashov
IFC Markets
Dimtry Lukashov is the senior analyst of IFC Markets. He started his professional career in the financial market as a trader interested in stocks and obligations.
















