|

Technical analysis: Will the corn price retreating halt?

Recommendation for Corn: Sell

Sell Stop: Below 537.5

Stop Loss: Above 622.9

RSI: Neutral

MACD: Sell

Donchian Channel: Sell

MA(200): Buy

Fractals: Neutral

Parabolic SAR: Sell

Chart analysis

Corn

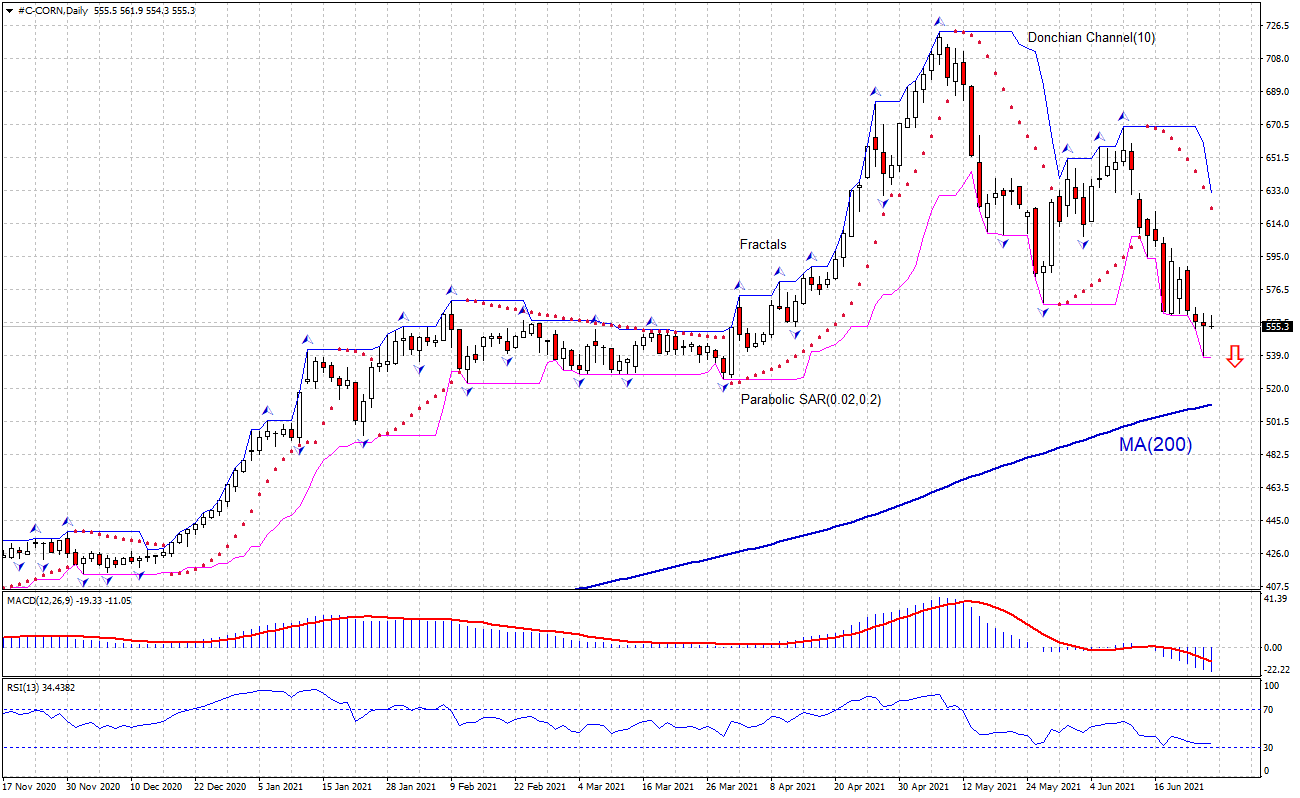
The #C-CORN technical analysis of the price chart in daily timeframe shows #C-CORN,Daily is falling above the 200-period moving average MA(200), which is rising still. We believe the bearish momentum will continue as the price breaches below the lower Donchian boundary at 537.5. A pending order to sell can be placed below that level. The stop loss can be placed above 622.9. After placing the order, the stop loss is to be moved every day to the next fractal high, following Parabolic signals. Thus, we are changing the expected profit/loss ratio to the breakeven point. If the price meets the stop loss level without reaching the order, we recommend cancelling the order: the market has undergone internal changes which were not taken into account.

Fundamental analysis

USDA downgraded nationwide corn crop condition rating for 2021 corn. Will the CORN price retreating halt? On Monday US Department of Agriculture released its latest Crop Progress Report indicating quality of the corn crop nationwide continued to deteriorate. USDA's weekly report showed that 65% of the corn crop nationally is rated good to excellent, down from 68% last week. That also compares to this time last year when 72% of the crop was in good to excellent shape. It also showed 6% of the crop nationally is in poor to very poor condition with conditions in the top corn producing states slipping, with Iowa’s growing conditions down 7 points. Conditions have deteriorated also in Illinois, Indiana, Minnesota Dakotas and Ohio. Lower supply expectations are bullish for corn price. However the technical setup is bearish for #C-CORN.


Want to get more free analytics? Open Demo Account now to get daily news and analytical materials.


Want to get more free analytics? Open Demo Account now to get daily news and analytical materials.

Author

Dmitry  Lukashov

Dmitry Lukashov

IFC Markets

Dimtry Lukashov is the senior analyst of IFC Markets. He started his professional career in the financial market as a trader interested in stocks and obligations.

More from Dmitry Lukashov
Share:

Markets move fast. We move first.

Orange Juice Newsletter brings you expert driven insights - not headlines. Every day on your inbox.

By subscribing you agree to our Terms and conditions.

Editor's Picks

EUR/USD climbs toward 1.1800 on broad USD weakness

EUR/USD gathers bullish momentum and advances toward 1.1800 in the second half of the day on Tuesday. The US Dollar weakens and helps the pair stretch higher after the employment report showed that Nonfarm Payrolls declined by 105,000 in October before rising by 64,000 in November.

GBP/USD climbs to fresh two-month high above 1.3400

GBP/USD gains traction in the American session and trades at its highest level since mid-October above 1.3430. The British Pound benefits from upbeat PMI data, while the US Dollar struggles to find demand following the mixed employment figures and weaker-than-forecast PMI prints, allowing the pair to march north.

Gold extends its consolidative phase around $4,300

Gold trades in positive above $4,300 after spending the first half of the day under bearish pressure. XAU/USD capitalizes on renewed USD weakness after the jobs report showed that the Unemployment Rate climbed to 4.6% in November and the PMI data revealed a loss of growth momentum in the private sector in December. 

XRP dips as bearish pressure persists despite ETF growth

Ripple is finding footing above $1.90 at the time of writing on Tuesday after a bearish wave swept across the broader cryptocurrency market, building on persistent negative sentiment.

Ukraine-Russia in the spotlight once again

Since the start of the week, gold’s price has moved lower, but has yet to erase the gains made last week. In today’s report we intend to focus on the newest round of peace talks between Russia and Ukraine, whilst noting the release of the US Employment data later on day and end our report with an update in regards to the tensions brewing in Venezuela.

BNB Price Forecast: BNB slips below $855 as bearish on-chain signals and momentum indicators turn negative

BNB, formerly known as Binance Coin, continues to trade down around $855 at the time of writing on Tuesday, after a slight decline the previous day. Bearish sentiment further strengthens as BNB’s on-chain and derivatives data show rising retail activity.