Tariff extensions and their impact on Gold price

Remember how I told you that the Tariff deadlines will likely be extended? It’s starting to happen.
Quoting Yahoo! Finance:
“Trump had targeted July 9 as a self-imposed deadline, when his "pause" on steep April tariffs would go back into effect. Global markets have been bracing for that potential shock, with the US only having reached deals with the UK and Vietnam, as well as a framework toward an agreement with China.
But on Sunday, both Treasury Secretary Scott Bessent and Trump suggested that while Trump could send out letters this week informing countries of their tariff rates, those duties would not go into effect until Aug. 1.
"President Trump's going to be sending letters to some of our trading partners saying that if you don't move things along, then on Aug. 1 you will boomerang back to your April 2 tariff level. So I think we're going to see a lot of deals very quickly," Bessent told CNN's "State of Union."”
The Peak Chaos theory is working and – as I wrote to my subscribers on Friday – even Trump’s escalation of conflict with Powell wasn’t able to make gold rally.
The opposite is taking place - gold is declining in today’s pre-market trading.

The breakdown below the lower of the support lines was clearly verified, and it’s quite obvious from the technical point of view that the tide has turned.
The long-term indicators confirm that a MAJOR top in gold is in as well.
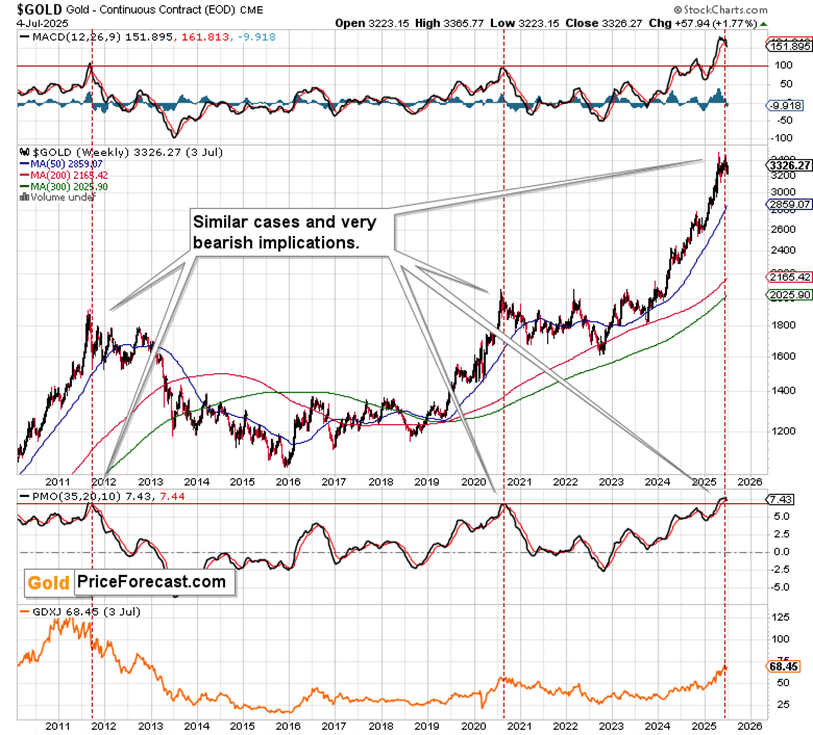
Overbought signals flash red
MACD and PMO indicators don’t flash major sell signals frequently.
But when they do – you better listen.
MACD based on weekly gold prices got more overbought than at the 2011 top, while the PMO got similarly (extremely) overbought. The only other case that’s similar is the 2020 top.
In both previous cases, we saw months (!) of declines in gold and mining stocks.
Again, this is not a short-term signal (I covered this on the first chart) – this is a huge, long-term red flat that we saw here. My gold price prediction for July 2025 is therefore bearish.
While gold and miners verified their breakdowns, the USD Index appears to have bottomed in tune with its monthly turning point.

Once we see confirmed breakouts above the declining resistance lines, we’ll know for (almost) sure that the medium-term bottom in the USD Index is in.
After all, it is the long-term support that worked, not just the short-term one.
As the 2022 – 2025 decline is just one big bullish ABC correction pattern? That seems quite likely to me.

Emotional support for Gold fades
Remember how the USD Index was considered trash in 2008 because of the twin deficit? That was THE long-term bottom. It’s now being considered as almost trash, as investors are losing faith in the stability related to the U.S. – not seeing (yet) that it’s all predictable negotiating tactics.
And since the precious metals and USD Index tend to move in the opposite directions, both extreme situations (overbought in the precious metals and oversold in the USD Index) confirm each other.
Before summarizing, I’d like to share two of the replies that I provided to my subscribers’ questions, as they are connected with the above analysis.
Q: PR, Trump just extended the tariff deadline from July 9th to August 1st, and you predicted this would happen. How does this fit your 'Peak Chaos' theory, and what does it mean for gold and the dollar?
A: Thank you for asking this question. As I wrote in my previous analysis, Trump now needs victories and deals rather than pure chaos. The extension to August 1st, combined with the Vietnam 'agreement' at 20% tariffs (still much higher than the original 3-5%), shows we're transitioning from chaos creation to negotiated outcomes.
This is crucial for precious metals because gold has been feeding off uncertainty and dollar weakness. But as these situations move toward resolution - even imperfect ones - the emotional support for gold diminishes while fundamental dollar strength reasserts itself.
Notice that even with maximum institutional uncertainty (Trump vs. Powell), tariff threats, and trade tensions, gold continues declining. This tells us the market is already looking past the chaos toward the reality that most of these policies are ultimately dollar-positive over time.
The deadline extension removes some immediate uncertainty, which can be negative for gold in the short term as 'fear trades' unwind.
Q: You mentioned mining stocks moved higher on the second-lowest volume in 10 years. Why is low volume during a rally such a concerning signal?
A: Thank you for this excellent question - volume analysis is one of the most underappreciated aspects of technical analysis.
When stocks rally on extremely low volume, it tells us that very few participants are actually enthusiastic about buying at these levels. Think of it like an auction where only a few bidders show up - prices might rise slightly, but there's no real conviction behind the move.
The fact that we saw the second-lowest volume in a decade during what should be an exciting breakout attempt is a classic warning sign. Healthy rallies require broad participation and enthusiasm. When volume is absent during advances, it usually means:
1. Institutional money isn't participating
2. Retail enthusiasm is waning
3. The move lacks sustainability
This volume pattern often precedes significant reversals because once selling pressure increases even slightly, there aren't enough committed buyers to support prices. It's like a building with a weak foundation - it might stand temporarily, but it won't survive much stress.
Want free follow-ups to the above article and details not available to 99%+ investors? Sign up to our free newsletter today!
Want free follow-ups to the above article and details not available to 99%+ investors? Sign up to our free newsletter today!
Author

Przemyslaw Radomski, CFA
Sunshine Profits
Przemyslaw Radomski, CFA (PR) is a precious metals investor and analyst who takes advantage of the emotionality on the markets, and invites you to do the same. His company, Sunshine Profits, publishes analytical software that any


