Taking money off the table

USD: Sept '24 is Down at 101.600.
Energies: Oct '24 Crude is Up at 70.90.
Financials: The Dec '24 30 Year T-Bond is Up 14 ticks and trading at 124.19.
Indices: The Sept '24 S&P 500 emini ES contract is 91 ticks Lower and trading at 5520.00.
Gold: The Dec'24 Gold contract is trading Down at 2520.60.
Initial conclusion
This is not a correlated market. The USD is Down and Crude is Up which is normal, but the 30 Year T-Bond is trading Up. The Financials should always correlate with the US dollar such that if the dollar is Higher, then the bonds should follow and vice-versa. The S&P is Lower and Crude is trading Higher which is correlated. Gold is trading Lower which is not correlated with the US dollar trading Down. I tend to believe that Gold has an inverse relationship with the US Dollar as when the US Dollar is down, Gold tends to rise in value and vice-versa. Think of it as a seesaw, when one is up the other should be down. I point this out to you to make you aware that when we don't have a correlated market, it means something is wrong. As traders you need to be aware of this and proceed with your eyes wide open. Currently all of Asia is trading Lower. All of Europe is trading Lower as well.
Possible challenges to traders
-
Trade Balance is out at 8:30 AM EST. This is Major.
-
JOLTS Job Openings is out at 10 AM EST. This is Major.
-
Factory Orders m/m is out at 10 AM EST. This is Major.
-
Wards Total Vehicle Sales - All Day by Brand. This is Major.
-
Beige Book is out at 2 PM EST. This is Major.
Traders, please note that we've changed the Bond instrument from the 10 year (ZN) to the 2 year (ZT). They work exactly the same.
We've elected to switch gears a bit and show correlation between the 2-year Treasury notes (ZT) and the S&P futures contract. The YM contract is the Dow Jones Industrial Average, and the purpose is to show reverse correlation between the two instruments. Remember it's likened to a seesaw, when up goes up the other should go down and vice versa.
Yesterday the ZT migrated Lower at around 8:15 AM EST with no news in sight and began its Upward climb. Look at the charts below and you'll see a pattern for both assets. The Dow moved Lower at 8:15 AM and the ZT moved Higher at around the same time. These charts represent the newest version of BarCharts, and I've changed the timeframe to a 15-minute chart to display better. This represented a Long opportunity on the 2-year note, as a trader you could have netted about 20 ticks per contract on this trade. Each tick is worth $7.625. Please note: the front month for ZT is Dec and the Dow is still Sept '24. I've changed the format to filled Candlesticks (not hollow) such that it may be more apparent and visible.
Charts courtesy of Barcharts
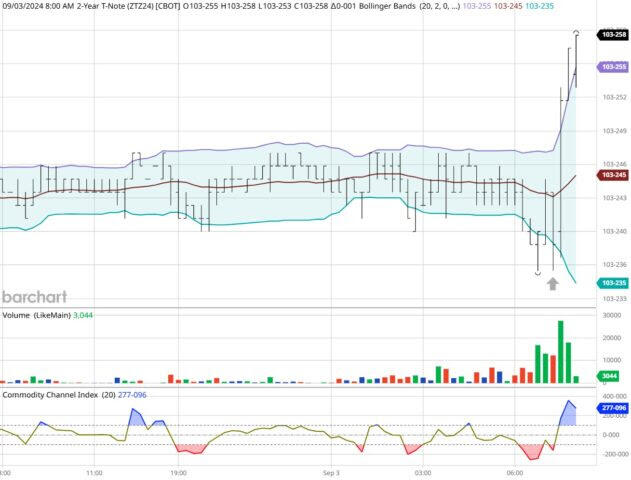
ZT -Dec 2024 - 09/03/24
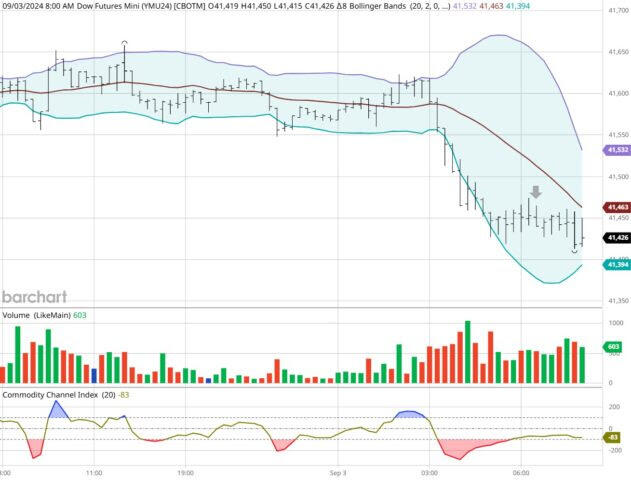
Dow - Sept 2024- 09/03/24
Bias
Yesterday we gave the markets a Downside bias as both the USD and Gold were Higher Tuesday morning and that usually represents a Down Day. The markets didn't disappoint as the Down fell by 626 points and the other indices lost ground as well. Today we aren't dealing with a correlated market and our bias is to the Downside.
Could this change? Of Course. Remember anything can happen in a volatile market.
Commentary
Yesterday being the first trading day after a major holiday we awoke to see the markets falling. Why did that happen? Was there some earth shattering news event that occurred? No. This was nothing more than traders taking money off the table after a runup in prices prior to the Labor Day holiday. Is this usual and customary? No. Usually the first day after a major holiday is when prices rise due to pent up demand due to lack of trading activity. We didn't see that this time around but another aspect could be talk of US Steel being sold to a Japanese concern. Both Trump and Harris want to keep US Steel as an American company and who could blame them? United States Steel was the first billion dollar corporation when it was founded in 1900. I believe Andrew Carnegie became (for a period of time) the world's richest man, too bad he didn't do much for his workers even though in their mind by offering a job they were being benevolent.
Author

Nick Mastrandrea
Market Tea Leaves
Nick Mastrandrea over 20 years experience in trading and formerly held a NASD Series 7. He currently holds a NJ Life, Health and Variable Authority. Nick is a published writer and his work has appeared in Futures Magazine, TraderPlanet and others.


