Strategy Idea: Low/limited risk bear spreads in oil

Low/limited risk put fly in August crude
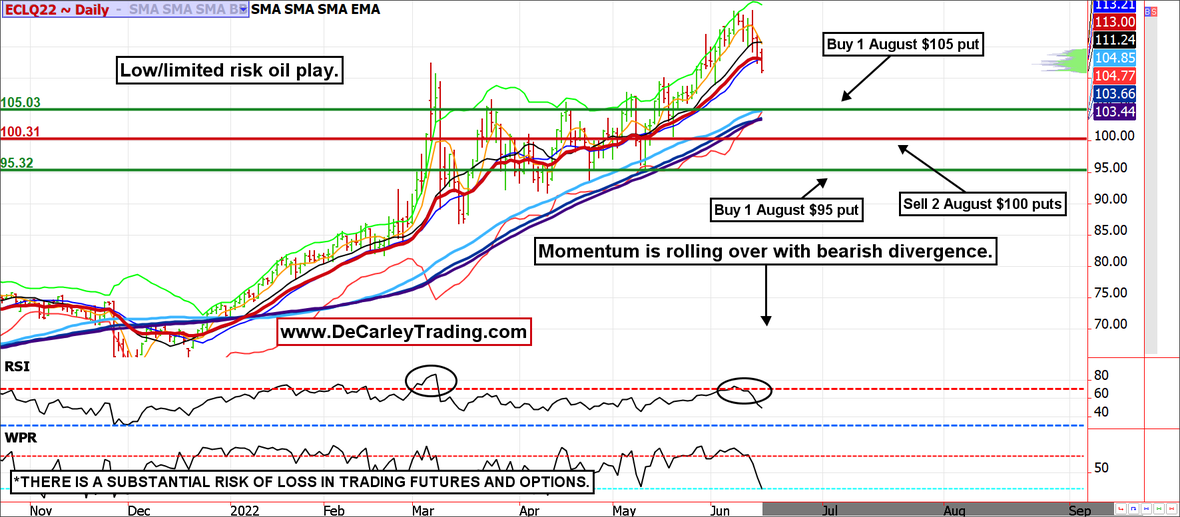
The oil market has been relentlessly volatile since March. Although the trend has been higher, traders on both sides of the market have likely felt quite a bit of pain. The rally has been plagued with instant $10 to $15 pullbacks. Oil has fallen about $10 per barrel in the last 48 hours and the chart suggests it could continue. This would be good news for consumers and investors (it would likely stop the stock and bond routes. For those looking to play the downside without unlimited risk or losing sleep at night, a put butterfly is a good way to get a foot in the door. Although it isn't a perfect strategy because traders who are too right about the direction might find out the spread loses anyway, nevertheless, the risk is low and limited.
BUY AUGUST CRUDE OIL PUT BUTTERFLY.
BUY 1 AUGUST OIL $105 PUT.
SELL 2 AUGUST OIL $100 PUTS.
BUY 1 AUGUST OIL $95 PUT.
*Total Cost = About 55 cents or $550.
These options expire on July 15, 29 days to expiration.
Margin = $0.
Risk = Limited to the cost of entry.
Maximum Profit = about $4400.
Zaner360 symbols:
OCLQ22 P105, OCLQ22 P100, OCLQ22 P95.

*There is a substantial risk of loss in trading futures and options. There are no guarantees in speculation; most people lose money trading commodities. Past performance is not indicative of future results.
*Past performance is not indicative of future results
Due to time constraints and our fiduciary duty to put clients first, the charts provided in this newsletter may not reflect the current session data.
Seasonality is already factored into current prices, any references to such does not indicate future market action.
These recommendations are a solicitation for entering into derivatives transactions. All known news and events have already been factored into the price of the underlying derivatives discussed. From time to time persons affiliated with Zaner, or its associated companies, may have positions in recommended and other derivatives. Past performance is not indicative of future results. The information and data in this report were obtained from sources considered reliable. Their accuracy or completeness is not guaranteed. Any decision to purchase or sell as a result of the opinions expressed in this report will be the full responsibility of the person authorizing such transaction. Seasonal tendencies are a composite of some of the more consistent commodity futures seasonals that have occurred over the past 15 or more years. There are usually underlying, fundamental circumstances that occur annually that tend to cause the futures markets to react in similar directional manner during a certain calendar year. While seasonal trends may potentially impact supply and demand in certain commodities, seasonal aspects of supply and demand have been factored into futures & options market pricing. Even if a seasonal tendency occurs in the future, it may not result in a profitable transaction as fees and the timing of the entry and liquidation may impact on the results. No representation is being made that any account has in the past, or will in the future, achieve profits using these recommendations. No representation is being made that price patterns will recur in the future.
Author

Carley Garner
DeCarley Trading
Carley Garner is an experienced commodity broker with DeCarley Trading, a division of Zaner, in Las Vegas, Nevada. She is also the author of multiple books including, “Higher Probability Commodity Trading” and “A Trader's First Book on Commodities”.


