Stocks At Record Highs: Market Sentiment Still Bullish

Our intraday outlook is bearish, and our short-term outlook is bearish. Our medium-term outlook remains neutral, following S&P 500 index breakout above last year's all-time high:
Intraday outlook (next 24 hours): bearish
Short-term outlook (next 1-2 weeks): bearish
Medium-term outlook (next 1-3 months): neutral
Long-term outlook (next year): neutral
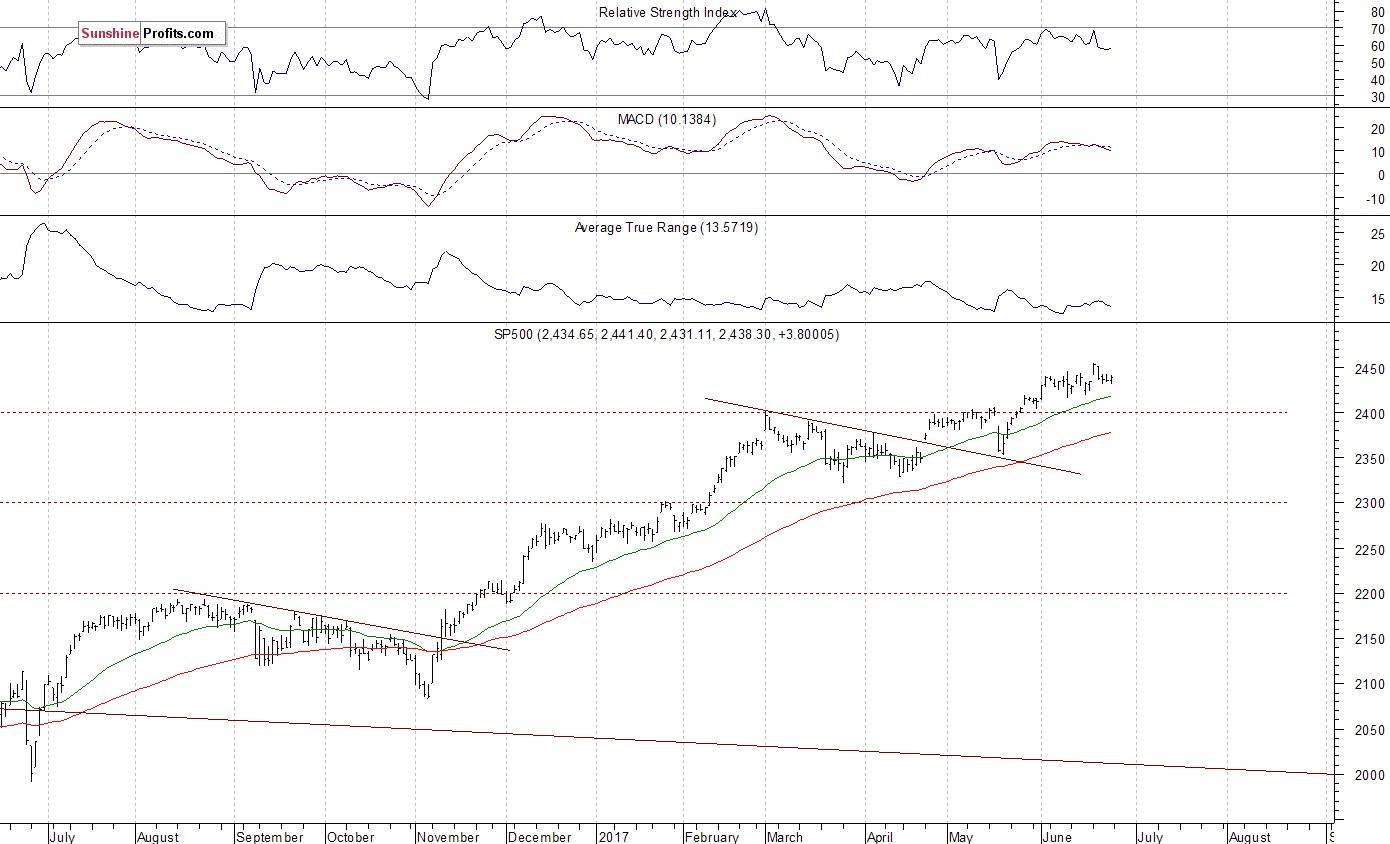
The U.S. stock market indexes were mixed between 0.0% and +0.5% on Friday, as investors continued to hesitate following economic data, quarterly earnings releases. The S&P 500 index remains relatively close to its last Monday's new all-time high of 2,453.82. It has reached new record high after a breakout above short-term consolidation along the level of 2,420-2,440. Stocks have rebounded strongly following their mid-May quick two-session sell-off and continued over eight-year-long bull market off 2009 lows. The Dow Jones Industrial Average remains close to its last Tuesday's new all-time high at the level of 21,535.03. The technology Nasdaq Composite was relatively stronger than the broad stock market on Friday, as it continued to retrace its recent move down. The nearest important support level of the S&P 500 index is at around 2,430-2,435, marked by last Monday's daily gap up of 2,433.15-2,441.79. The next level of support is at 2,415-2,420, marked by some recent local lows. The support level is also at 2,400-2,410, marked by the May 25 daily gap up of 2,405.58-2,408.01, among others. On the other hand, level of resistance is at 2,450-2,455, marked by new all-time high. There have been no confirmed negative signals so far. However, we can see overbought conditions and negative technical divergences. The S&P 500 index is trading within its three-week-long consolidation, as we can see on the daily chart:
Will Uptrend Continue?
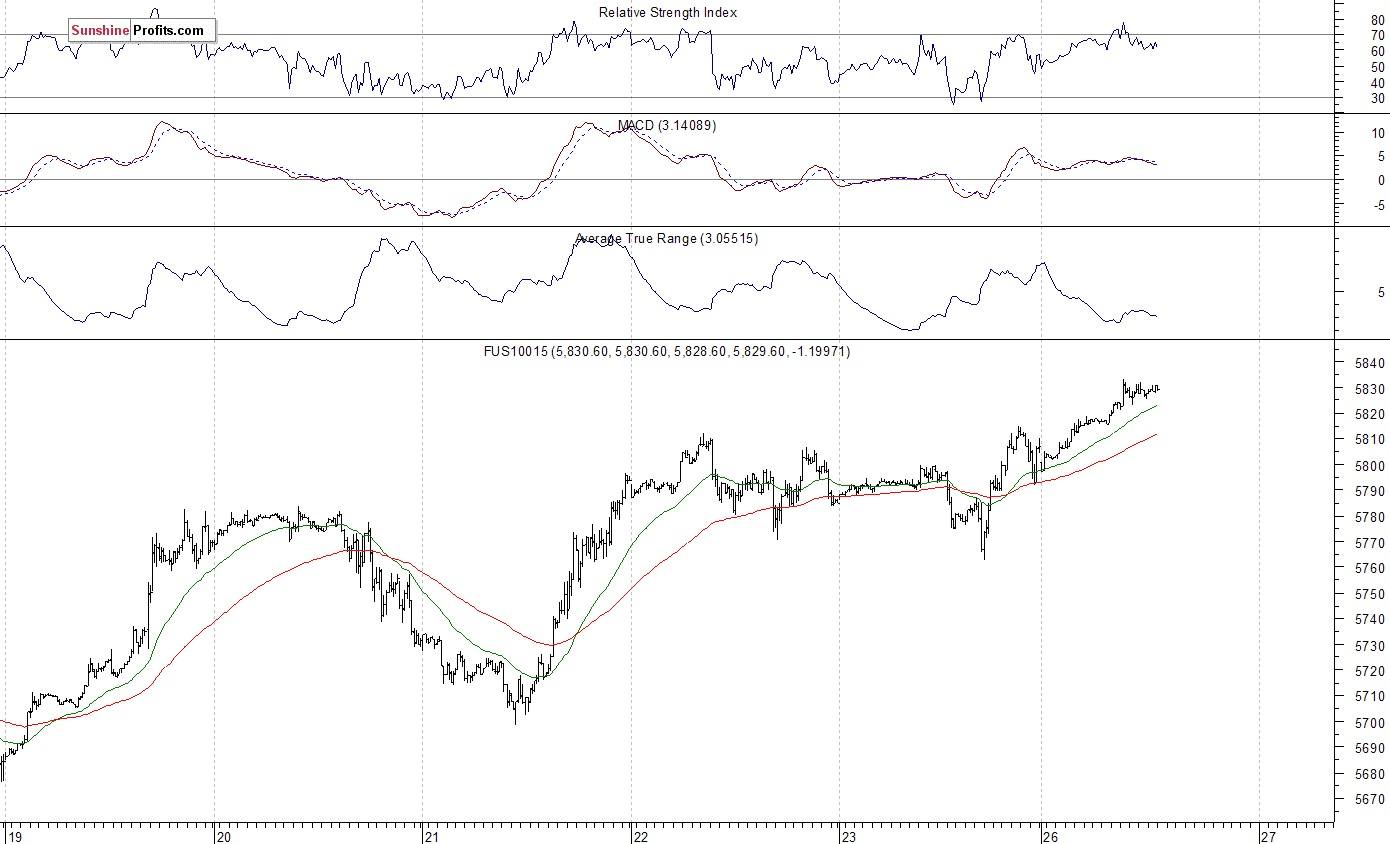
Expectations before the opening of today's trading session are positive, with index futures currently up 0.3% vs. their Friday's closing prices. The European stock market indexes have gained 0.7-1.0% so far. Investors will now wait for the Durable Orders number release at 8:30 a.m. The market expects that it fell 0.6% in May. The S&P 500 futures contract trades within an intraday uptrend, as it breaks above its last week's consolidation along the level of 2,430. The nearest important level of support is at 2,425-2,430, marked by last Monday's gap-up opening, among others. The next support level is at around 2,415-2,420, marked by recent local lows. The nearest important level of resistance is at around 2,445-2,450, marked by record high, among others. The market extends its short-term consolidation, as it continues to trade along all-time high. Is this a topping pattern before downward reversal or just flat correction within an uptrend? There have been no confirmed negative signals so far.
Positive Expectations
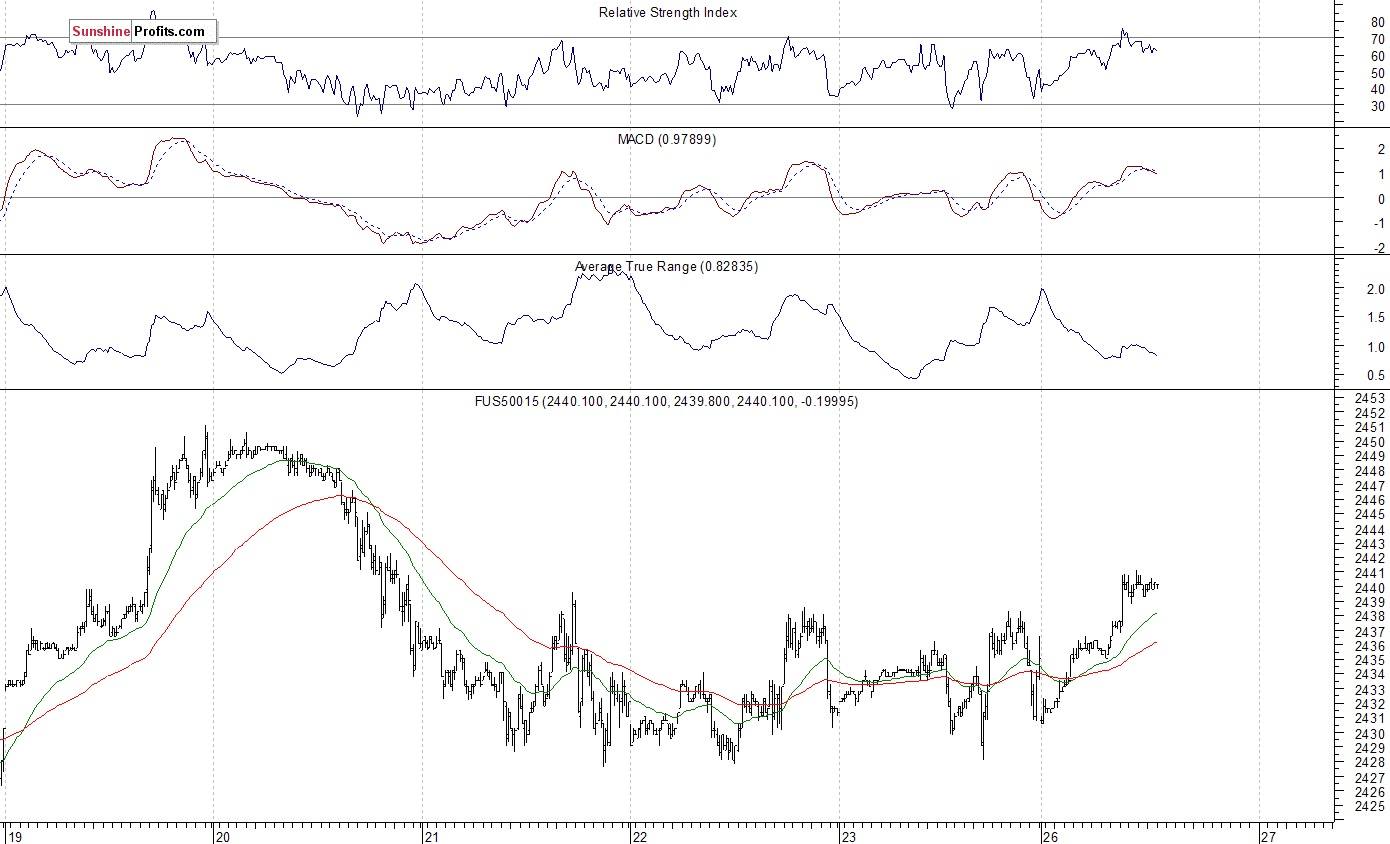
The technology Nasdaq 100 futures contract follows a similar path, as it currently trades within an intraday uptrend. It retraces some more of June 9 sell-off. The nearest important level of resistance is at 5,840-5,850, marked by previous short-term local lows. The next resistance level is at around 5,900, marked by record high. On the other hand, support level is at around 5,800-5,810, marked by previous level of resistance. The next support level is at 5,770, among others, as the 15-minute chart shows:
Concluding, the S&P 500 index continued to trade relatively close to record high on Friday. Will over eight-year-long bull market continue? Or is this some medium-term topping pattern accompanied by very bullish investors' sentiment? There have been no confirmed negative signals so far. However, we still can see negative technical divergences, along with medium-term overbought conditions.
If you enjoyed the above analysis and would like to receive free follow-ups, we encourage you to sign up for our daily newsletter – it’s free and if you don’t like it, you can unsubscribe with just 2 clicks. If you sign up today, you’ll also get 7 days of free access to our premium daily Gold & Silver Trading Alerts.
Want free follow-ups to the above article and details not available to 99%+ investors? Sign up to our free newsletter today!
Author

Paul Rejczak
Sunshine Profits
Paul Rejczak is a stock market strategist who has been known for the quality of his technical and fundamental analysis since the late nineties.


