Stock markets remained under pressure

GER30, H4
In my yesterday post, I wrote: “Intra-day, the index manage to gain so far up to 0.35% and it is currently traded above its intra- day R1 at 12,620.00 but also above all 3 MAs. The hourly momentum indicators in turned slightly weaker due to the bearish momentum noticed the last hour, but RSI and MACD remain above neutral zone, giving more of buying signals so far. Therefore even in the short-term, the bullish bias remains, and any swing low could treated as a buying opportunity.
Only a break below the 12,543-12,560 today, which is between the 20-period MA and the PP level, should present weakness and an indication that selling pressure increases. If GER30 break this area, then next immediate Support comes at 12,493 and down to the 50-period MA at 12,440.”
However on yesterday’s close and so far today, the overall positive daily picture of GER30 has been ruined, and therefore the bearish momentum identified in the hourly chart verified overnight but so far today as well. The European stock markets are selling off today, with concerns over corporate earnings and a global rise in yields that is seeing 10-year Treasury yields flirting with the 3% mark outweighing the impact of the strong USD and the dip in EUR and pound against the dollar. Global central banks remain on course to take out more stimulus, while markets start to fear the turn of the growth cycle. The GER30 is leading the way with a decline of -2.6%. Industrials and utilities in particular are under pressure and yesterday’s second attempt to break the 12600 proved short lived.
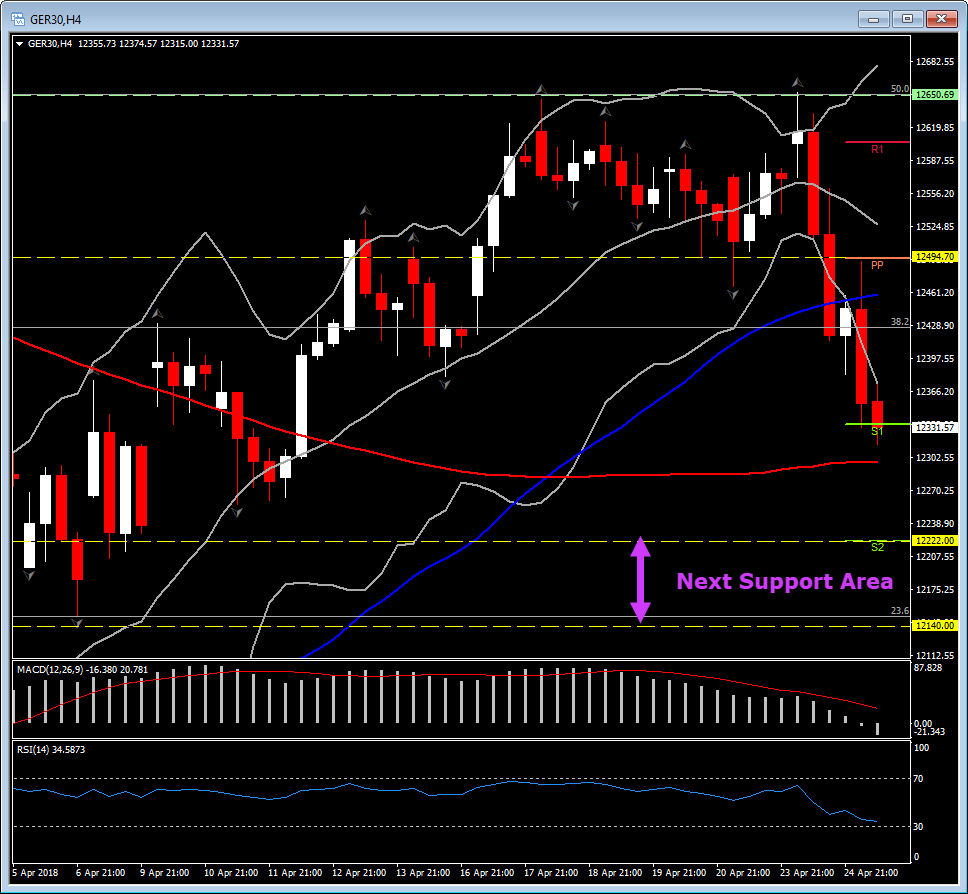
As mentioned in yesterday’s post, the asset held an immediate support at 12,440, which was a strong resistance area back in March. On the continuous increase of the selling pressure seen since yesterday, this support level broke, along with the next support at 20-DAY MA, at 12,316.00. Therefore, the next support comes at the 23.6% Fibonacci level at 12,140.00 level. By reviewing the intra-day charts such as the 4-hour chart, the bearish momentum seen since yesterday, seems to keep growing, without any oversold signs so far.
In the 4-hour chart, the pair has been seen forming large bearish candles the last 4 sessions, with a small attempt higher during Asian session. The GER30 is currently traded below the 50-period MA, outside the Bollinger Bands Pattern, with the lower Bollinger Bands Pattern extended to the downside. Meanwhile, the Momentum indicators suggest continuation to the downside, with MACD turning negative while signal line is still in neutral zone, and RSI sloped down to 30 area, looking ready to move further down.
In conclusion, the Daily support in a Daily time-frame, comes at 12,140.00 , while in shorter time-frame, the next immediate support comes 12,222.00.
There's more! Access all our latest analyses and other great content by subscribing to the HotForex Youtube channel. You can also talk to our experts live by registering for one of our free webinars!
Author

Having completed her five-year-long studies in the UK, Andria Pichidi has been awarded a BSc in Mathematics and Physics from the University of Bath and a MSc degree in Mathematics, while she holds a postgraduate diploma (PGdip) in


