Can You Spot the EXPANDING FLAT Pattern?
Wow! – it’s been a really busy summer!! – but very profitable too! Although attention is usually focused on the major U.S. indices like the S&P 500, even if you don’t trade positively-correlated indices from other countries, we always advise analysing them as if you were.
A good example was how two European indices, the Eurostoxx 50 and Xetra Dax 30 played out from May’s highs into August’s lows. Back in May/June, our Elliott Wave Navigator and Elliott Wave Compass reports had identified a corrective pattern unfolding from the May’s highs, as a developing 2nd wave correction. Can you spot what pattern that is? – Yes, an expanding flat!
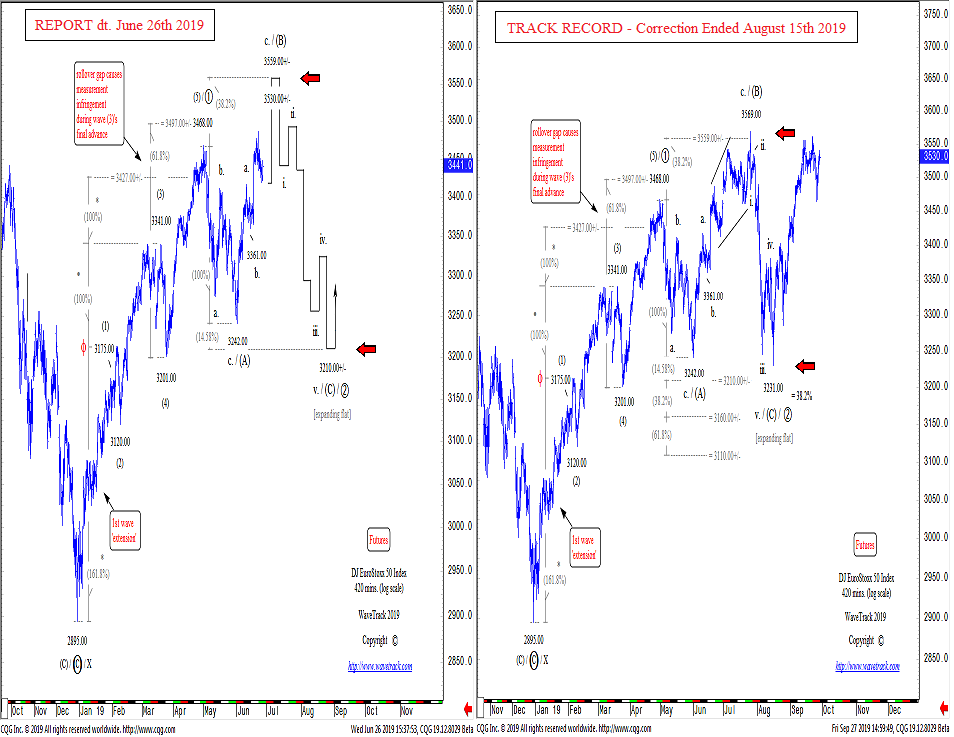
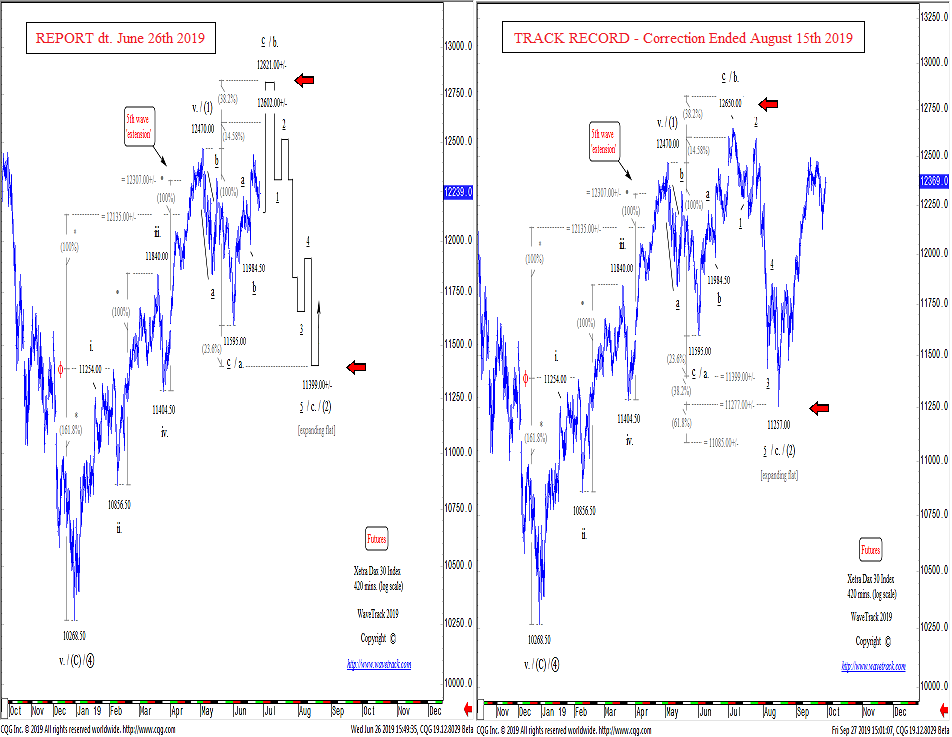
The expanding flat is a three wave sequence, A-B-C subdividing 3-3-5. For the Eurostoxx 50, (A)-(B)-(C) where wave (A) sets the initial price-range – to fulfil the pattern, waves (B) and (C) must marginally complete beyond wave (A)’s range whilst unfolding into a three and five wave sequence. If those conditions, those requirements are met, then the pattern can complete and is validated at predetermined fib-price-ratio levels – see figs #1 & #2.
Basis charts in report/s dt. June 26th, wave (B) upside targets for the Eurostoxx 50 were towards 3530.00+/-, to max. 3559.00+/- then a five wave impulse decline to begin declines as wave (C) towards 3210.00+/-. The actual high for wave (B) was 3569.00 and the low for (C) at 3231.00.
The Xetra Dax had minor wave b. upside targets towards 12602.00+/-, max. 12821.00+/- then a five wave impulse decline to begin declines as wave c. towards 11399.00+/-. The actual high for wave b. was 12650.00 and the low for c. at 11257.00.
Conclusion
The completion of these expanding flat patterns was also replicated in London’s FTSE-100 index. Moreover, it gave validation that other major indices, like the benchmark S&P 500 would also stage a reversal-upswing in August, despite unfolding into a slightly different corrective pattern. This affirms our belief that trading a set of indices should be supported by analysing other related groups too!
If you want more Elliott Wave analysis from Wavetrack for Stocks Indices, Fixed Income, Currencies (FX) and Commodities, click here
WaveTrack International and its related publications apply R.N.Elliott's "The Wave Principle" to historical market price activity which categorises and interprets the progress of future price patterns according to this methodology. Whilst it may be reasonable to deduce a course of action regarding investments as a result of such application, at no time or on any occasion will specific securities, futures, options or commodities of any kind be recommended for purchase or sale. Publications containing forecasts are therefore intended for information purposes only. Any opinion contained in these reports is only a statement of our views and are based on information we believe to be reliable but no guarantee is given as to its accuracy or completeness. Markets are volatile and therefore subject to rapid an unexpected price changes. Any person relying on information contained in these reports does so at their own risk entirely and no liability is accepted by WaveTrack in respect thereof. © All rights are copyrights to WaveTrack. Reproduction and / or dissemination without WaveTrack's prior consent is strictly forbidden. We encourage reviews, quotation and reference but request that full credit is given.
Recommended Content
Editors’ Picks
EUR/USD steady below 1.0800 after US PCE meets expectations
EUR/USD remains depressed below 1.0800 after soft French inflation data, amid minimal volatility and thin liquidity on Good Friday. The pair barely reacted to US PCE inflation data, with the Greenback shedding some pips. Fed Chair Jerome Powell set to speak ahead of the weekly close.
GBP/USD hovers around 1.2620 in dull trading
GBP/USD trades sideways above 1.2600 amid a widespread holiday restraining action across financial markets. Investors took a long weekend ahead of critical United States employment data next week. Fed Chair Powell coming up next.
Gold price sits at all-time highs above $2,230
Gold price holds near a fresh all-time high at $2,236 in thinned trading amid the Easter Holiday. Most major world markets remain closed, although the United States published core PCE inflation, the Federal Reserve’s favorite inflation gauge.
Jito price could hit $6 as JTO coils up inside this bullish pattern
Jito (JTO) price has been on an uptrend since forming a local bottom in early January. Since then, JTO has revisited the key swing point formed in early December, suggesting the bulls’ intention to move higher.
Key events in developed markets next week
Next week, the main focus will be inflation and the labour market in the Eurozone. We expect services inflation to be impacted by the easter effect, while the unemployment rate to be unchanged.