Sterling rebounds on softer Brexit hopes but can it continue?

Market Overview
The UK Parliament has roundly rejected the Government’s proposed deal with the EU on Brexit. The defeat was widely expected, but the size of the deal is an overwhelming smack in the face for the Prime Minister and means the need for Plan B. The reaction on sterling would suggest that Plan B involves a far softer form of Brexit, along with a likely extension to Article 50. However the big question is whether traction can come from this or whether political paralysis will suck the impetus from the sterling rally. Although the UK is legislated to leave the EU on 29th March (with or without a deal), this will now surely be averted in the search for an alternative. A “no deal” (hard) Brexit is still a possibility, but there will now surely be a move towards preventing one. Although there has been a vote of no confidence already tabled by the opposition Labour Party, this is highly unlikely to succeed either and the Government will presumable plod along as they feel around for a softer form of Brexit that can command a majority in the House of Commons which is somewhere in the region of 70% in favour of the UK remaining in the EU. Sterling rallied last night because of this. However, equally there is paralysis in the Commons as there is no single version of Brexit that commands a majority. This paralysis may prevent sterling from rallying decisively further. Away from the UK, the fluctuations in risk appetite have swung a shade more positively this morning and the dollar is seeing more of a mixed outlook. The potential for further fiscal stimulus from China to combat the recent slowdown has helped to underpin a rebound on oil and equities.

Wall Street closed higher again with the S&P 500 +1.0% at 2610, whilst Wall Street futures are looking for this move to continue another +0.2% today. Asian markets have been uncertain how to read Brexit newsflow, with the Nikkei -0.5% but Shanghai Composite (flat) has been supported. European markets look set for a mixed to positive open with FTSE futures +0.1% and DAX futures +0.4%. In forex, there is a mixed look to the dollar today, although it is interesting to see it losing ground on a mildly positive yen. This comes despite the more positive outlook for the commodity currencies as the Aussie, Kiwi and Canadian dollar all shade higher. The euro is an interesting underperformer today. In commodities, the touch of dollar weakness is helping to support gold and silver, whilst oil is also steady after yesterday’s rebound.
As the dust settles on UK assets, there is another potential driver of direction on the economic calendar this morning, with UK inflation for December at 0930GMT. Expectation is that UK headline CPI will fall to +2.1% (from +2.3% in November) which would be the lowest level of inflation since January 2017, whilst core CPI is expected to remain at +1.8% (+1.8% in November). US Retail Sales will be at 1330GMT which are expected to show ex-autos sales growing by +0.1% in the month of December (+0.2% MoM in November) which would still be decent given that November contained Black Friday. The EIA oil inventories are at 1530GMT which are expected to show another crude oil drawdown of -3.0m barrels (-1.7m barrels last week), whilst distillate inventories are expected to increase by +1.5m barrels (+10.6m last week) and gasoline inventories building by +3.0m (+8.1m last week).
Chart of the Day – USD/CAD
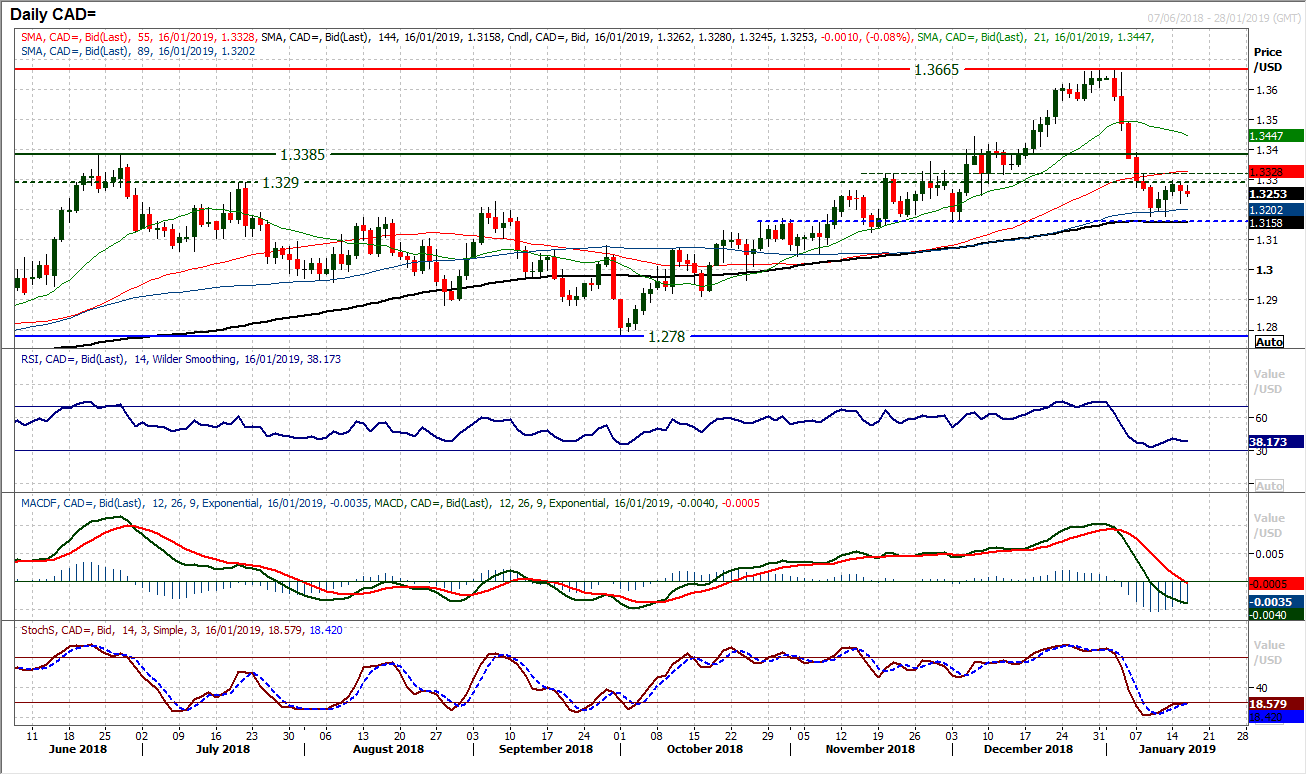
It is fairly clear that through the moves on the Canadian dollar in recent months, there is a very close correlation with the prospects of the oil price. Call oil right and this gives a steer on USD/CAD. The two seem to be strongly negatively correlated. It is not surprising therefore that whilst the dollar gained ground across the majors, with a rebound on oil, we also saw outperformance of the Canadian dollar. USD/CAD took a decisive downside break back in early Jan and the move below what was a support band of old breakouts between 1.3290/1.3385 which has left now a 95 pip resistance band overhead. This band held the rally back on Monday before yesterday’s negative candle. It looks as though rallies are now a chance to sell. This comes with momentum indicators which are still negatively configured as the Stochastics, RSI and MACD lines are now negatively configured. Renewed selling pressure would drive a rest of the pivot of the past few months at 1.3160, with last week’s low at 1.3175. A close below 1.3160 would also be a key move below the 144 day moving average once more.
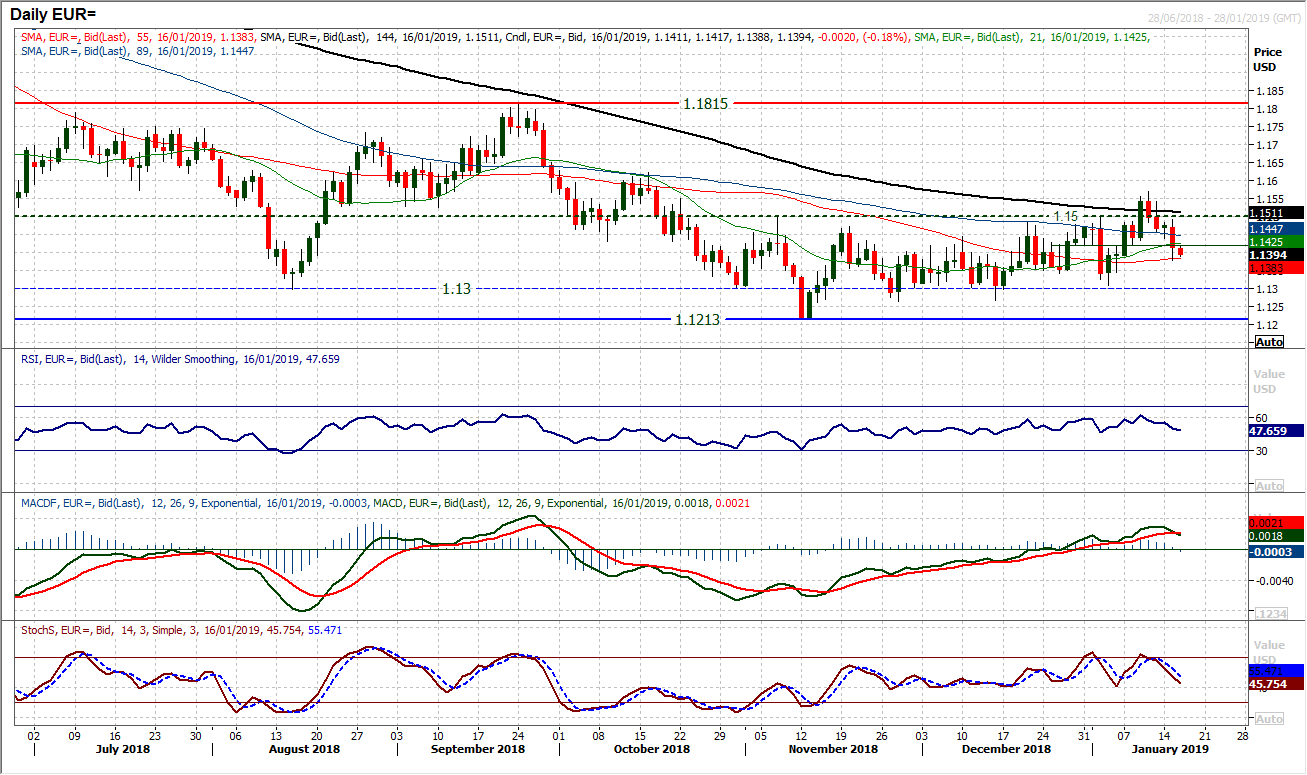
The euro did not get the late session uplift that sterling got, and so therefore another negative candle has formed. This is a disappointment for the bulls and seems to have now put the rally on the backburner for the time being. A fall below the near term pivot support at $1.1420 pulls the market decisive back into the ranging conditions of the November/December sideways band. The lows consistently came as the market approached $1.1300 whilst resistance was $1.1500 (it was interesting to see yesterday’s intraday rally fail at $1.1490). Momentum needs to be watched now as there is still the positive bias to the medium term configuration, but the near term slip back shows the bulls are not in control now. The hourly chart shows that the $1.1420 pivot is still a feature of the near term outlook coming into today’s session. For the bulls to regain their drive a close above $1.1420 is needed. Initial support at $1.1375.
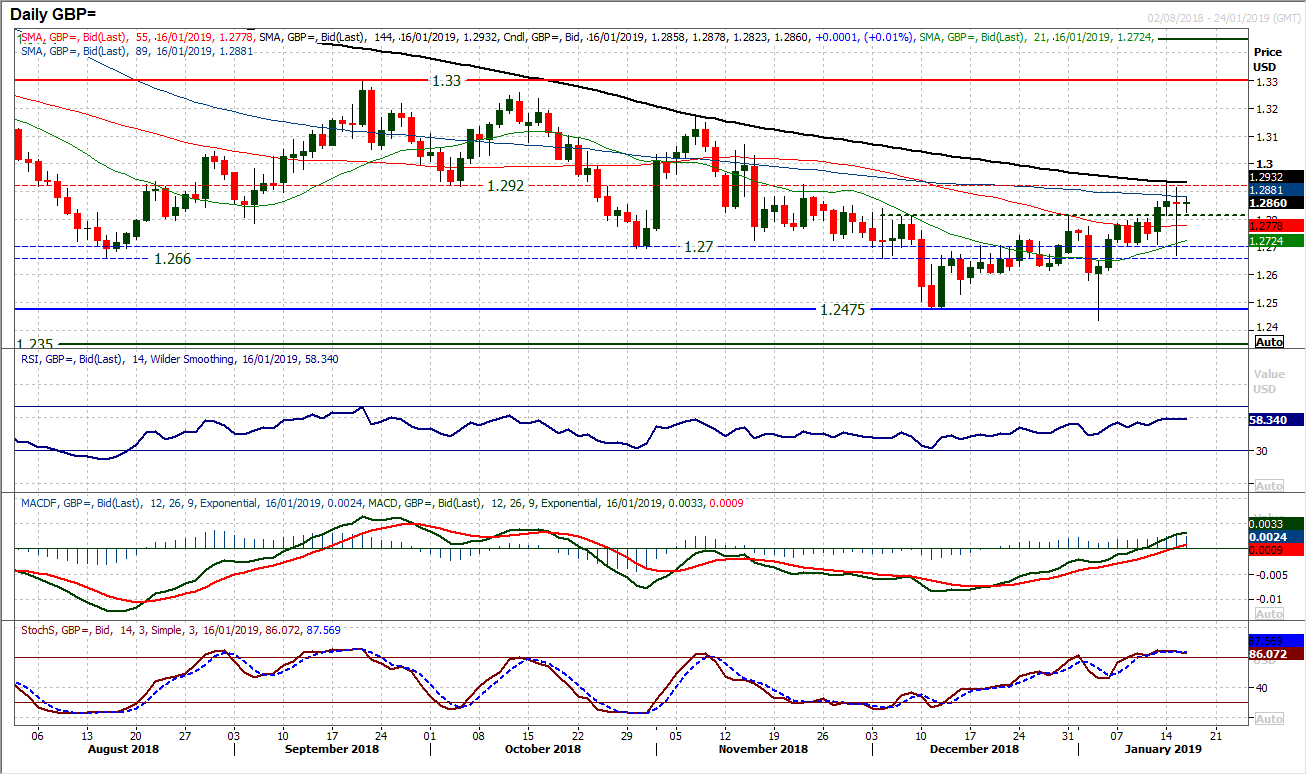
We expected volatility and this certainly played out late in the session as traders bought sterling on the Government defeat in the Brexit vote last night. Playing out for a path towards a likely softer Brexit may underpin the market initially, however it is interesting to see Cable forming a doji candle (open and close at the same point) in a session of 250 pips of daily high/low range. The market also seems to have stabilised overnight and is showing little real direction this morning. Holding above $1.2800 may be an interesting signal as this was previously a breakout level and is a basis of support. There is still a positive configuration on momentum, but are they beginning to sag? The calculation of the Stochastics means that yesterday’s low way down at $1.2668 is a drag, whilst the bulls may start to get nervous again if the market drops back below $1.2800. Resistance at $1.2930 from Monday. The hourly chart is still settling but there is now more of a corrective configuration threatening. The overnight rebound high of $1.2890 is initial resistance.
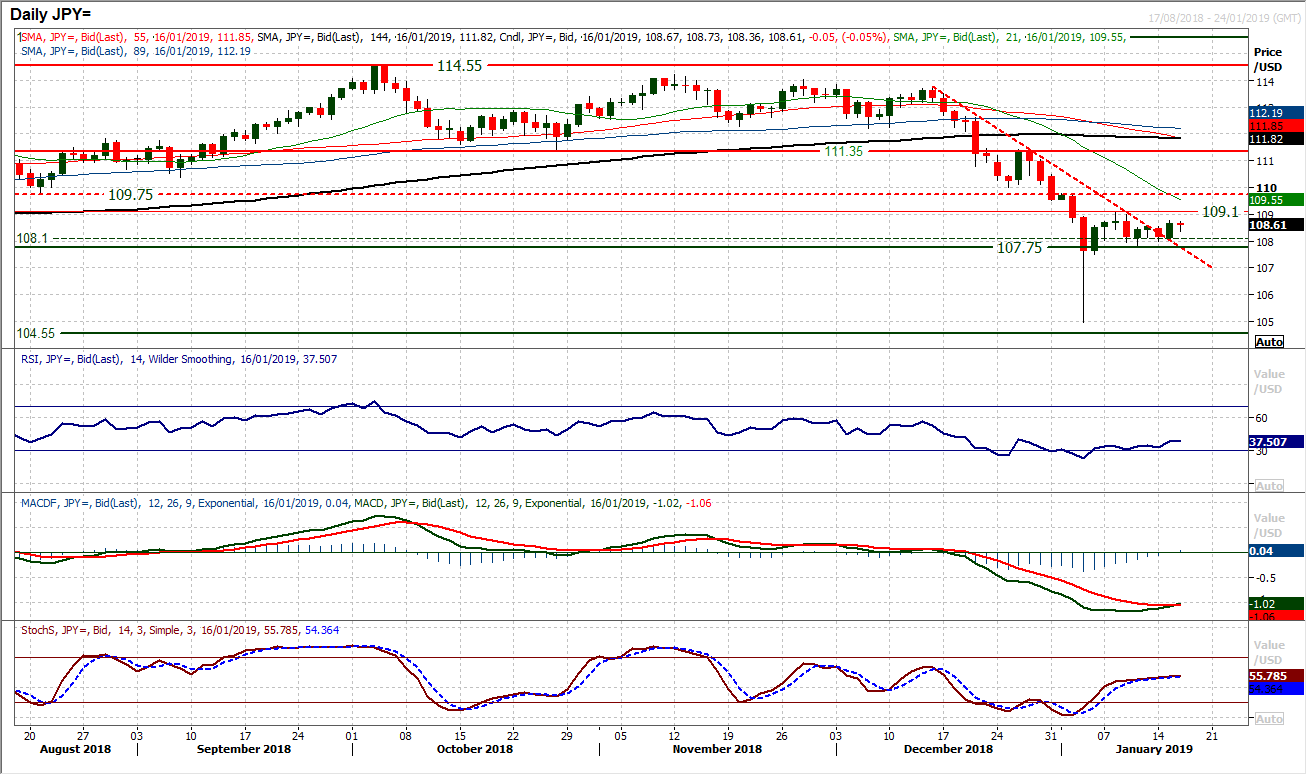
The positive candle that added 50 pips yesterday now confirms that the four week downtrend is no longer a factor for this chart, however this does not mean the market is imminent for a rally. The market has now settled to trade between 107.75/108.00 as a basis of support up to 109.10 in the past near two weeks since the flash crash. Whilst the support is consistently forming as the market approaches 108.00 there seems to be little upside traction, as once again the market has dropped back this morning. This is leaving initial resistance at 108.75. Momentum indicators appear uncertain and lack conviction, with the Stochastics plateauing around 50, whilst the MACD lines have bottomed. However, with the RSI only creeping marginally above 30, this still points towards consolidation rather than potential for building a sustainable recovery. This is a market in wait and see mode now, but rallies still look to be an opportunity to sell.
Gold
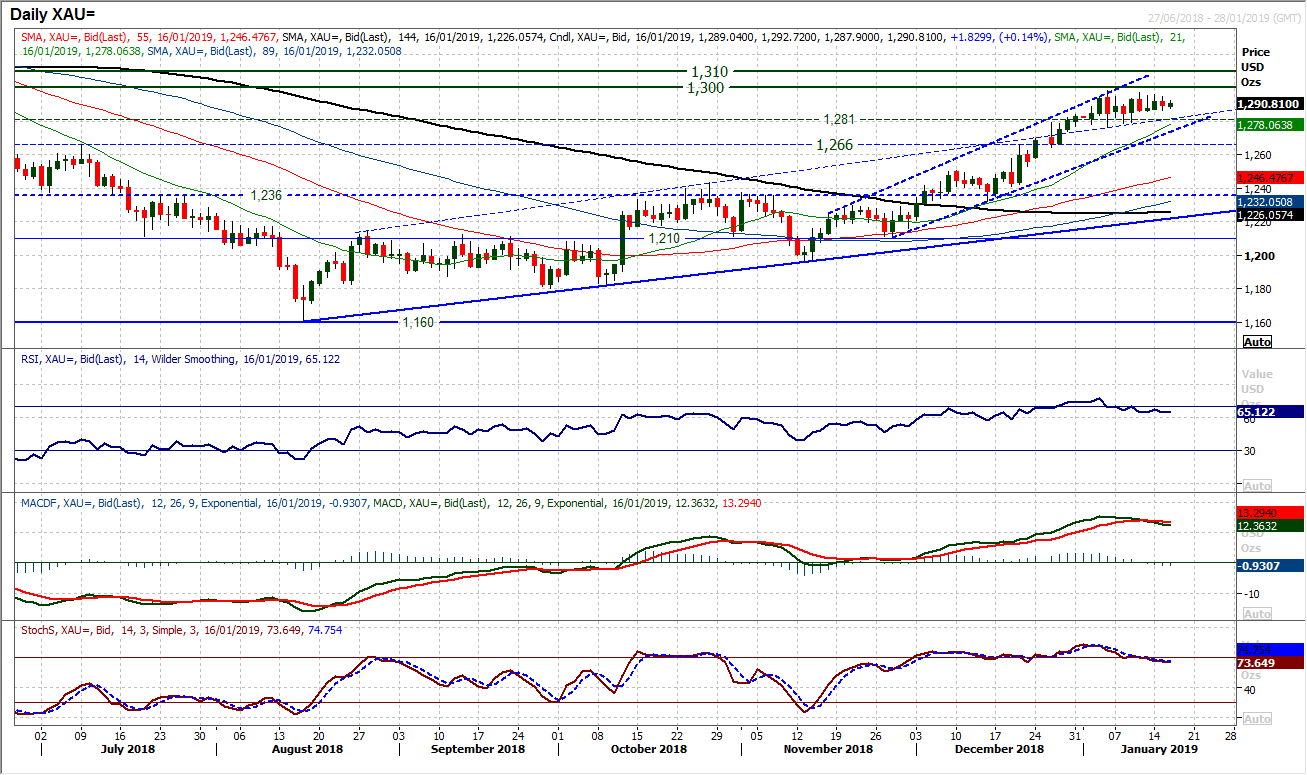
Daily analysis on gold is almost a cut and paste job at the moment as another neutral candlestick reflects the continuation of the recent trading range that is now into its 12th session trading inside a $22 range between $1276/$1298. There has been a slip lower on the momentum indicators, but as we laid out yesterday, this can be expected during a consolidation and can actually be a healthy move to help renew upside momentum (it would be a different story if the price was rising and there was a negative divergence with falling momentum). This now seems to be a waiting game on gold. The hourly chart show an increasing range play with oscillation on momentum indicators lacking direction and flat moving averages. Initial support is at $1285.75 above the support in the $1276/$1280 region. A closing break above $1298 would then immediately encounter the long term pivot resistance $1300/$1310.
WTI Oil
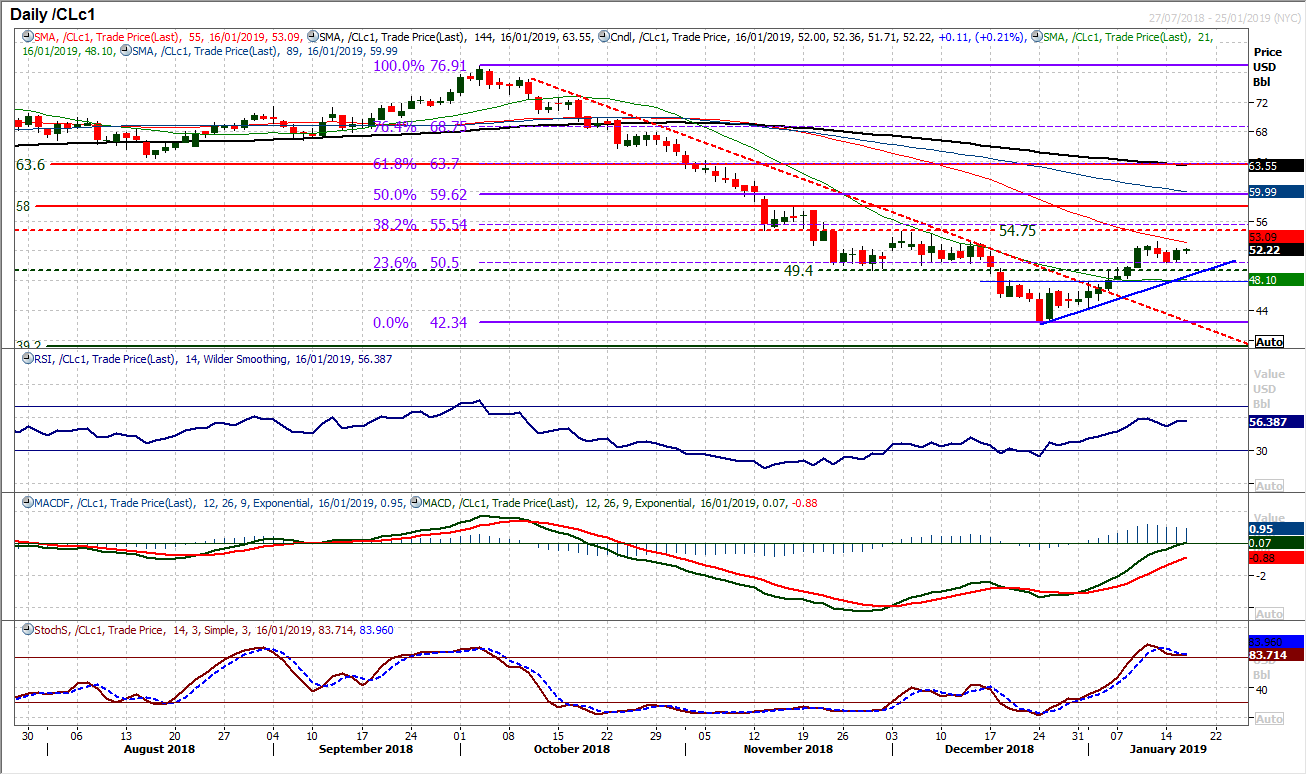
With the recent breakout above the old support band $49.40/$50.50 the outlook changed and the bulls look far better positioned. The recent correction of Friday and Monday subsequently looks to be an opportunity rather than a threat to the bulls. This is reflected in the more positive configuration on momentum indicators with the RSI holding above 50, MACD lines still rising and Stochastics maintaining their strong position. The breakout $49.40/$50.50 is also now a basis of support for corrections, whilst the 23.6% Fibonacci retracement of the big bear market adds to support around $50.50. Yesterday’s bull candle helped to build confidence once more and the bulls will be eyeing a retest of the rebound high at $53.30 again. Weakness is now a chance to buy and there is an uptrend rising at $48.50 today as an extra buffer.
Dow Jones Industrial Average
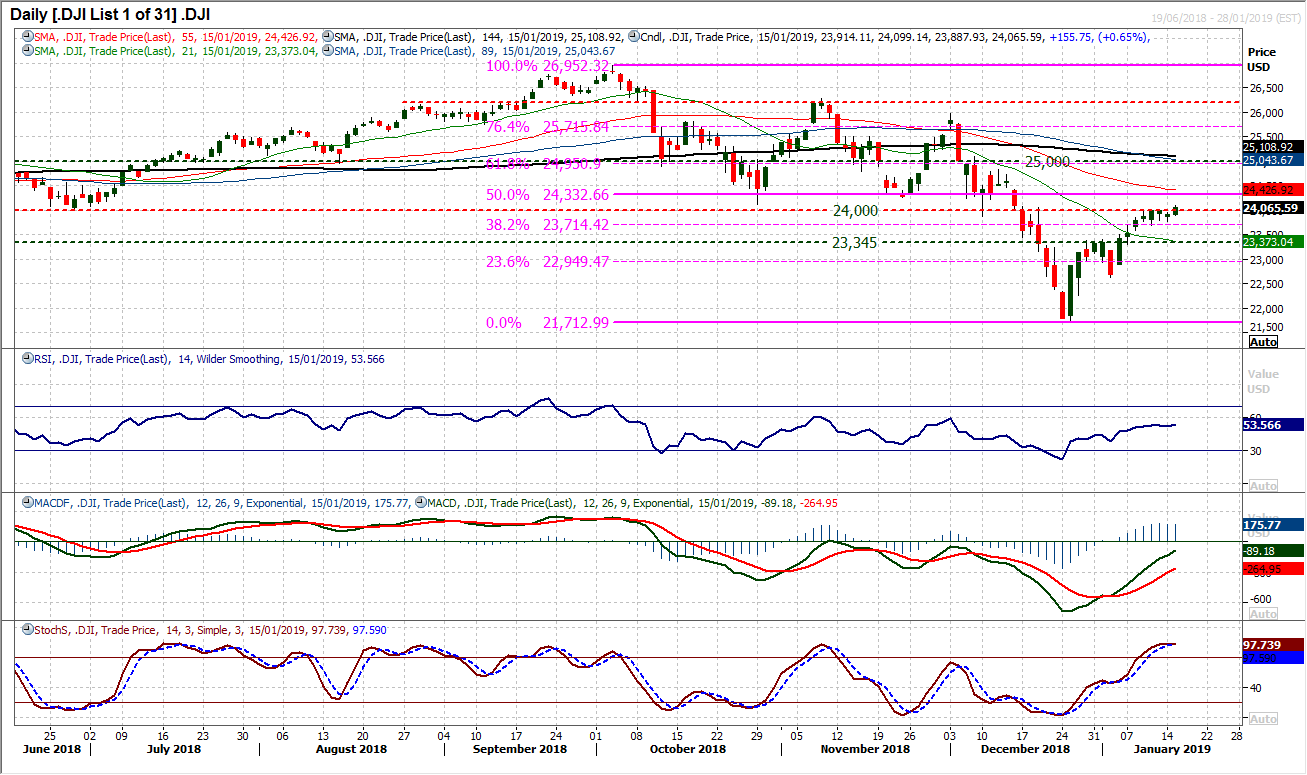
After a few days of consolidation the bulls are tentatively looking to push forward again. Yesterday’s decisive close above 24,000 which has been a barrier in the past week, suggests the bulls are ready to continue the rally. The move leaves 23,700 as a basis of an initial higher low. However, it is important to see the momentum indicators following the market higher and as yet the RSI seems to be a bit sluggish. Despite this though there is still positive configuration for the Stochastics above 80, MACD lines rising and RSI above 50. The next resistance is minor around 24,430 with an old lower high at 24,828.
Author

Richard Perry
Independent Analyst


