Sterling had its worst week for over three years last week [Video]
![Sterling had its worst week for over three years last week [Video]](https://editorial.fxstreet.com/images/Markets/Currencies/Majors/GBPUSD/iStock-1078115946.jpg)
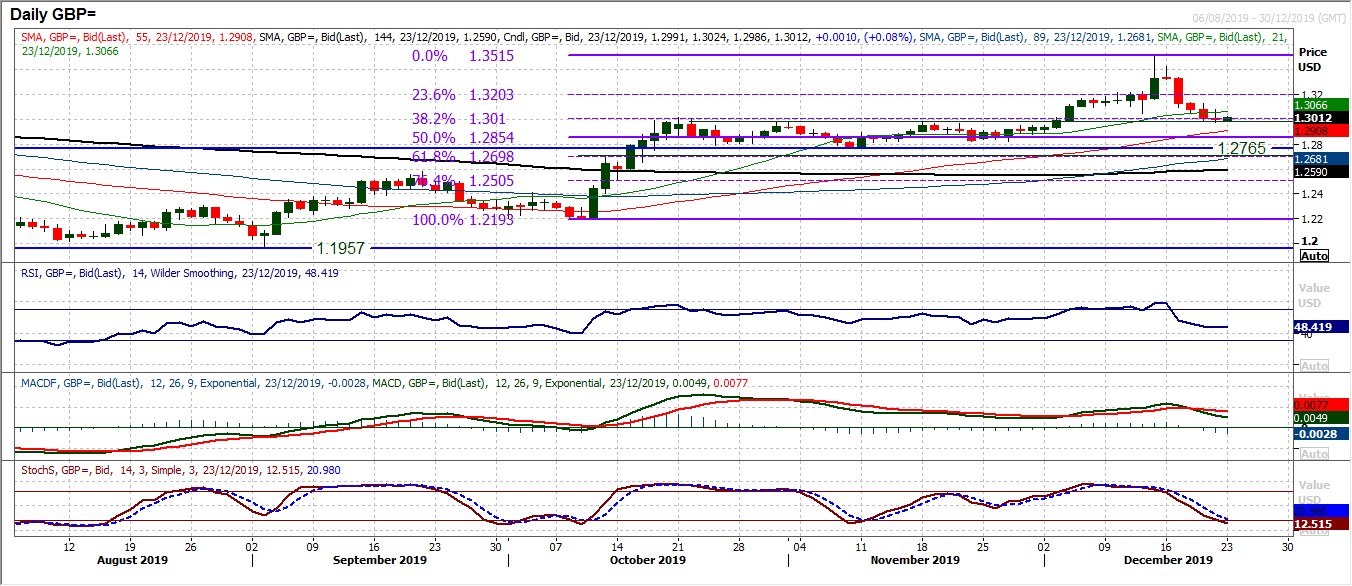
GBP/USD
Sterling had its worst week for over three years last week. Losing over -330 pips this was the biggest correction since the October 2016 flash crash. However, the selling pressure was abating slightly into Friday’s close and there is a degree of support now forming around the 38.2% Fibonacci retracement (of $1.2193/$1.3514) at $1.3010. Considering this was the key breakout support of the old highs $1.2975/$1.3010, this is an important support area for the bulls to protect. Momentum indicators have been corrective on the recent decline, but are also around key levels now. RSI needs to hold around 50 (a shade below now), MACD lines above neutral and Stochastics now back around key turning levels (of previous months). Volatility is still elevated (although this is likely to subside into Christmas week) but breaking the run of lower daily highs is needed. Resistance at $1.3080 from Friday. For a sense of support (and possible recovery) to build, hourly RSI above 60, and MACD above neutral. A close below $1.2975 continues the retracement, with the 50% Fib at $1.2850 and support at $1.2820.
Author

Richard Perry
Independent Analyst
Richard Perry, Independent Market Analyst, has over 20 years of experience working in financial markets in London.


