Speculators dump gold but price goes up anyway

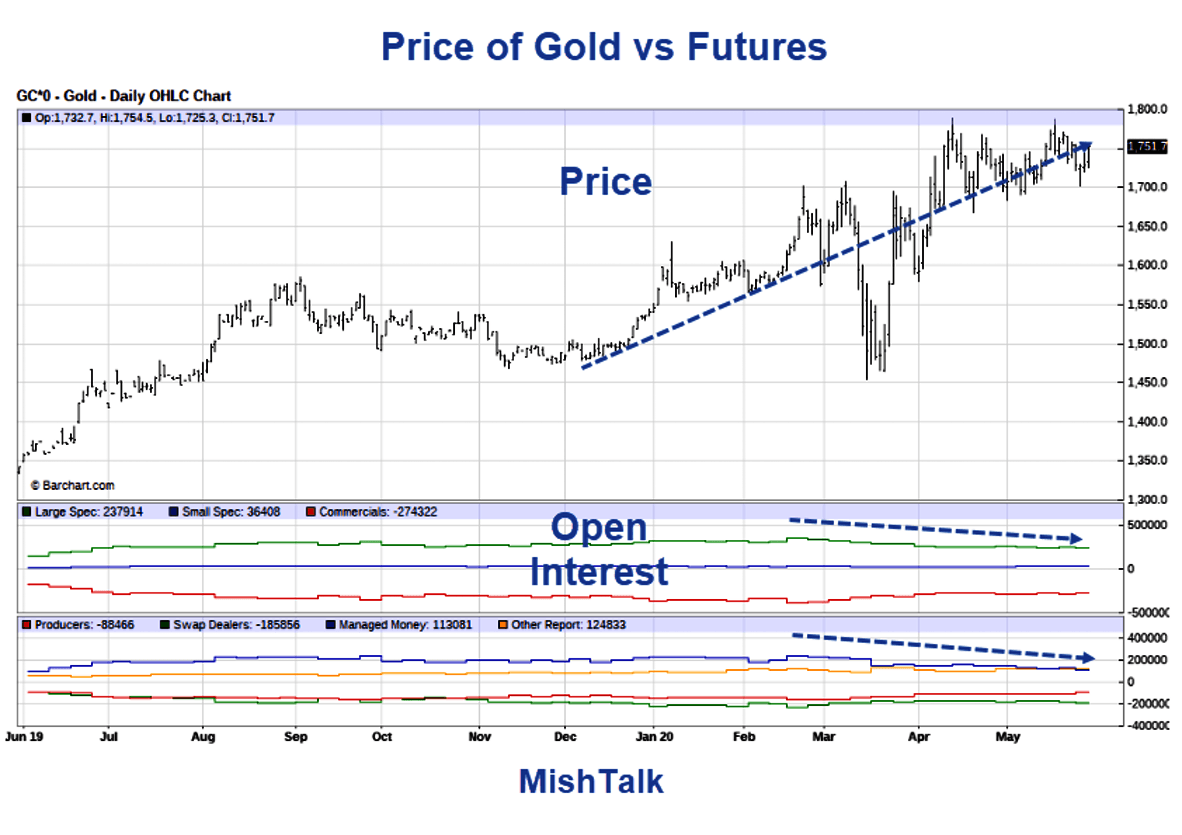
Judging from futures and alleged jewelry demand, the price of gold ought to be falling. But it isn't. Let's explore what's happening with the price of gold and why.
The above chart is courtesy of Barchart. The anecdotes are mine.
In the futures world, for every long there is a short. Contracts net to zero.
The commercials are producers who sell their gold and the broker-dealers who are hedged.
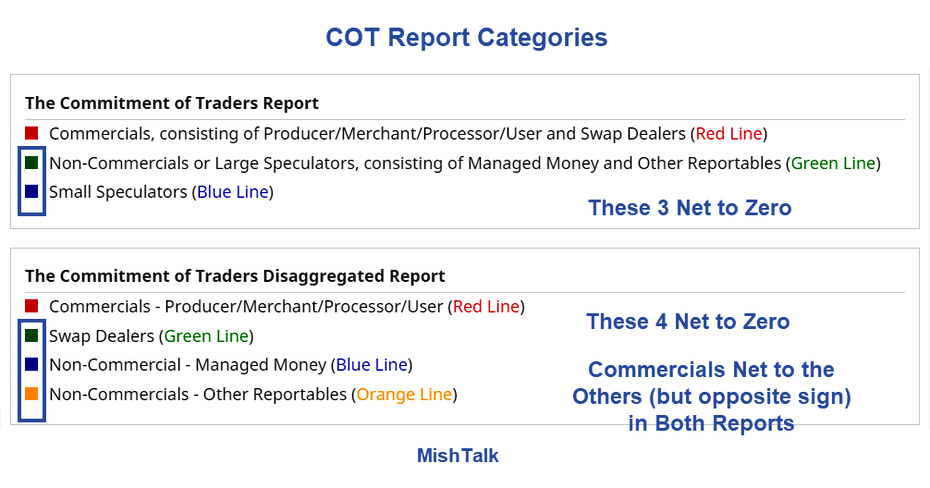
COT Report Categories
Speculators Dump Gold But Price Goes Up Anyway
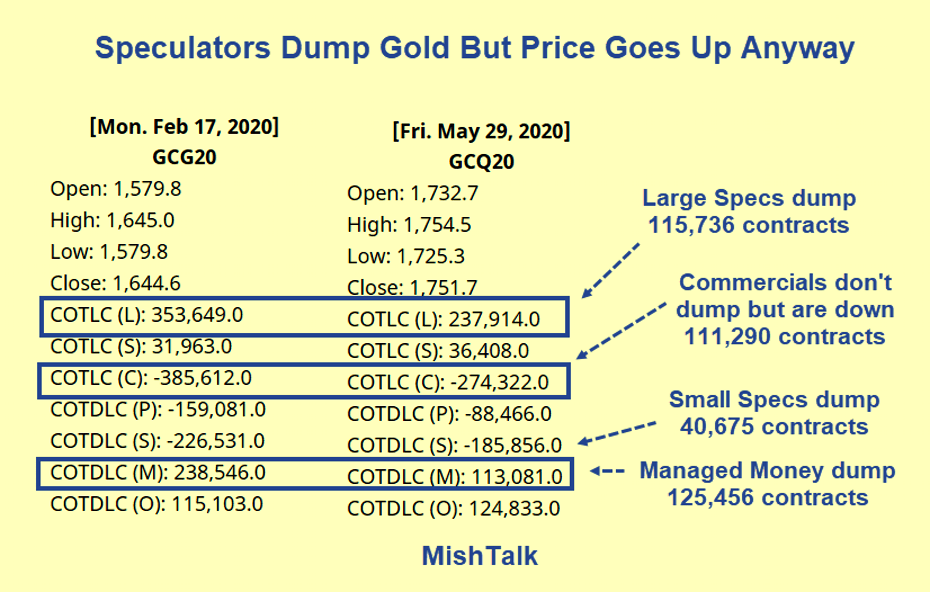
Note that commercials are down 111,290 contracts since February. This is not "covering shorts" as often claimed. Rather it reflects speculators dumping contracts.
Managed money dumped 125,456 contracts. Yet, the price of gold rose from $1,644.60 to $1,751.70.
Let's go back further, to August 2010.
Gold August 2010
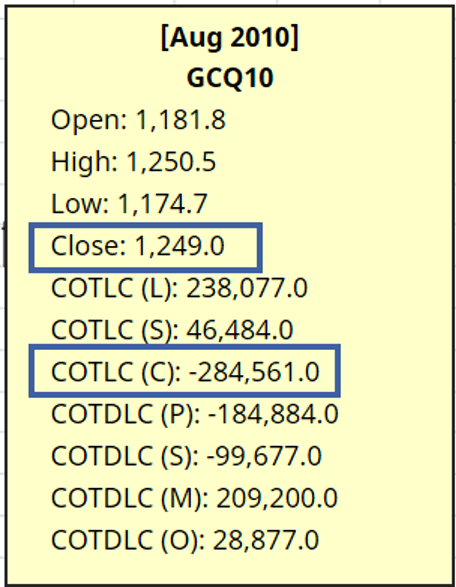
I picked that date because the open interest to today is quite similar. 284,561 contracts short in August 2010 vs 274,322 today. The price of gold was then $1,249.
The level of shorts has little to do with the price of gold except as a measure of short-term price fluctuations.
Normally when speculators add contracts, the price of gold rises and when speculators are liquidating contracts, the price falls. But not even that is happening now.
What About Jewelry?
According to the World Gold Council, demand for Gold jewelry in 2019 fell 6 percent overall to 2,107 tons. How did the price of gold react?
Gold vs Jewelry Demand
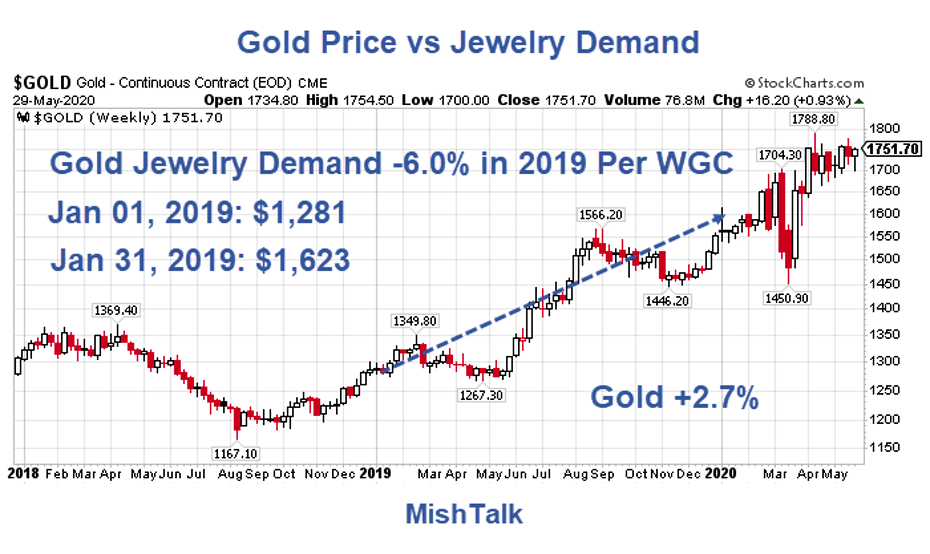
The price of gold does not follow marginal jewelry usage either.
Marginal Utility?
The subject of marginal utility of gold and jewelry came up in a Twitter discussion this weekend.
Jewelry is totally irrelevant to the price of gold.
— Mike "Mish" Shedlock (@MishGEA) May 30, 2020
The supply of gold is nearly every ounce ever mined. Curiously, similar to Bitcoin.
Misunderstanding the Supply of Bitcoin and Gold Leads to Silly Projections - for bothhttps://t.co/4c4t4PBK2B https://t.co/MlFAd5sXs5
Misunderstanding the Supply of Bitcoin and Gold Leads to Silly Projections
I covered the topic recently in Misunderstanding the Supply of Bitcoin and Gold Leads to Silly Projections
People confuse jewelry buying with the demand for gold and bitcoin mining with supply of Bitcoin.
Contrary to popular myth, the supply Bitcoin goes up every day. This is why halving the mining rate of Bitcoin did nothing for the price.
Similarly, people confuse demand for new gold jewelry as the demand for gold.
Charts like this perpetuate all kinds of silliness.
Jewelry is totally irrelevant to the price of gold.
— Mike "Mish" Shedlock (@MishGEA) May 30, 2020
The supply of gold is nearly every ounce ever mined. Curiously, similar to Bitcoin.
Misunderstanding the Supply of Bitcoin and Gold Leads to Silly Projections - for bothhttps://t.co/4c4t4PBK2B https://t.co/MlFAd5sXs5
That chart does NOT represent the demand for gold.
It says, 52.44% of new mining was used in Jewelry. So what? Did that set the price of gold or affect it at all?
Misconceptions About Gold
The best explantionation of the demand for gold comes from Pater Tenebrarum at the Acting Man blog. He was my teacher in Austrian economics.
Tenebrarum wrote Misconceptions about Gold as a guest post on my blog in June of 2007 under the pseudonym Trotsky, a name he regrets.
Gold was $650 at the time.
Gold Supply and Demand
If gold's price were determined by fabrication demand alone (jewelry and industrial uses), it could not possibly trade at a price of $650 oz.
Many gold analysts, from the mainstream to fringe groups such as the Gold Anti-Trust Action Committee (GATA) claim that they can predict what the gold price will do by adding up annual fabrication and investment demand (as well as dehedging demand by miners) and contrasting the resulting total with annual supply (mine supply, central bank selling, disinvestment and scrap). In short, they analyze the gold market in the same manner as they would analyze the copper market.
It should be immediately obvious that this can't be correct. After all, nearly the entire gold ever mined (approximately 150,000-160,000 tons) is still here. In short, the total potential supply of gold is some 97-98% greater than the gold produced every year (approximately 2,600 tons).Jewelry Demand vs. Monetary Demand
One can further illustrate gold's unique nature as money with a study of gold prices vs. jewelry demand. If record fabrication demand for gold (jewelry) must be good for the price of gold, then a historic high in jewelry demand should in theory coincide with a high gold price.
However, record high jewelry demand in 1999 - 2000 in actual fact coincided with a 20 year bear market low in the gold price - the exact opposite of what traditional commodity supply/demand analysis would suggest.
We can therefore conclude that there must be a source of gold demand that is of far greater importance than the jewelry and industrial demand components, and that demand constitutes the true driver of the price of gold in terms of fiat money.Indeed, there is. This demand component is called 'monetary demand'. Monetary demand and the supply of gold is actually best described as the 'degree of reluctance of the current owners of gold to part with their gold at current prices' since, as mentioned above, some 160,000 tons are owned by somebody already.
Jewelry Usage
Jewelry demand is about 500 tonnes or so out of a supply total now up to 190,000 tons or so, minus some percentage lost or tied up in priceless art.
Assume 20,000 tons of gold lost or in art, and we can calculate new jewelry demand as 500/170,000 = .0029.
The idea that jewelry has a meaningful impact on the price of gold is thus ridiculous.
Unfortunately, the World Gold Council itself spreads jewelry nonsense as the "demand for gold".
Bloomberg, the Wall Street Journal, and countless other also perpetuate the myth so it's no wonder people are confused.
Gold vs Faith in Central Banks
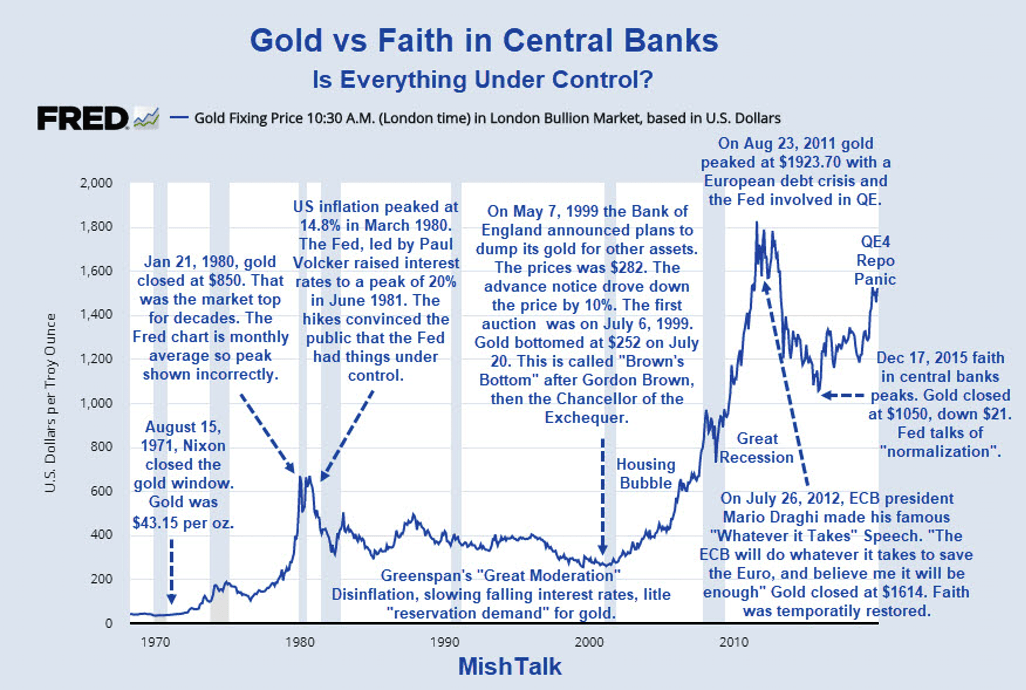
Demand for gold is a actually a reflection on faith in central banks.
When people believe central banks have everything under control, the price of gold falls.
The best example is Greenspan's great moderation when he was consider the maestro. Gold fell from $850 to $250.
Mario Draghi's "Whatever it Takes" speech is another key example.
Alleged Gold Shortage
The second widely perpetuated myth is that there is a shortage of gold.
That's pretty funny given there is roughly 190,000 tons of supply.
The myth stems from short-term demand fluctuations for certain forms of gold, typically coins, resulting in price spikes for that form, but not gold itself.
Shills then come out of the woodwork and profess buy gold while you still can.
What If?
Another popular shortage argument pertains to futures.
The futures battle cry is "If only everyone would take delivery, we would run out of gold" and the commercials would be ruined.
The commercials would not be ruined or they would have been ruined long ago. They were short the entire run from $250 to now. The commercials are either hedged or they are the producers who sell their production via futures.
Moreover, futures speculators do not reflect a demand to own gold, they reflect a demand to rent gold with leverage.
We would not run out of gold if everyone took delivery, but the price would indeed rise.
Gold is Not the New Unobtanium
Even the Wall Street Journal falls into the trap of perpetuating these myths.
Author

Mike “Mish” Shedlock's
Sitka Pacific Capital Management,Llc


