Speculators are adding to shorts in both stocks and treasuries
We've talked about the shorts in stock indices, but what about treasuries?
Treasuries, both the 10-year note and the 30-year bond, have recovered from Their dramatic 2022 lows. But with the Fed still hiking rates and inflation still high, there are more bears than bulls in the futures markets.
Further, US banks likely learned the hard way what interest rate risk could do to the solvency of an operation that borrows on the short end of the curve, to lend on the long end. Those lessons have likely pushed them (and other individuals and institutions) into aggressive hedges (selling short Treasury futures to hedge their long Treasury portfolio). As a result, similar to the historically large short position held by E-mini S&P 500 speculators, traders appear to have gotten "too short" Treasuries.
Treasury futures markets
30-year Treasury Bond Futures
Large speculators are sitting on historical short positions
With the exception of 2018, speculators have never been more short Treasuries than they are now. Sometimes, market positioning and the unwinding of overcrowded trades have more of an impact on price than market fundamentals. We could be on the verge of one of those times.
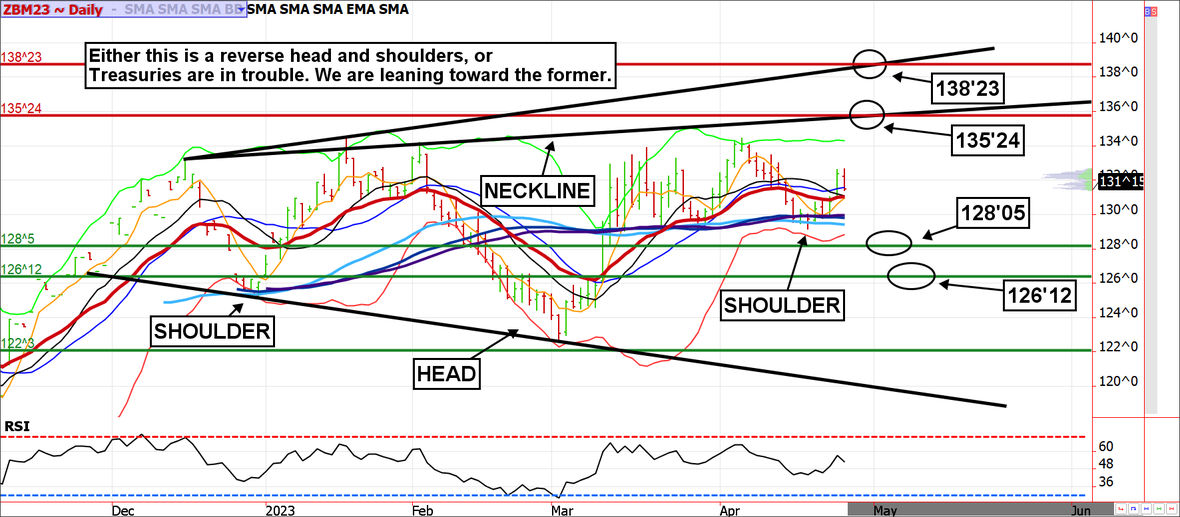
The 30-year bond daily chart has formed a reverse head and shoulders pattern. If the neckline is penetrated, the rally could be stunning, but the first target would be about 138'28.
Treasury futures market consensus
The 30-year bond will likely seek to test the head and shoulders neckline near 135'24; a break above this level would likely trigger quite a bit of upside volatility.
Technical Support: 131'03, 128'05, 126'12, and 122'03 ZN: 114'31, 114'06, 112'13,110'27 and 109'26
Technical Resistance: ZB: 134'10 135'24 and 138'23 ZN: 117'02 and 119'15
Stock index futures
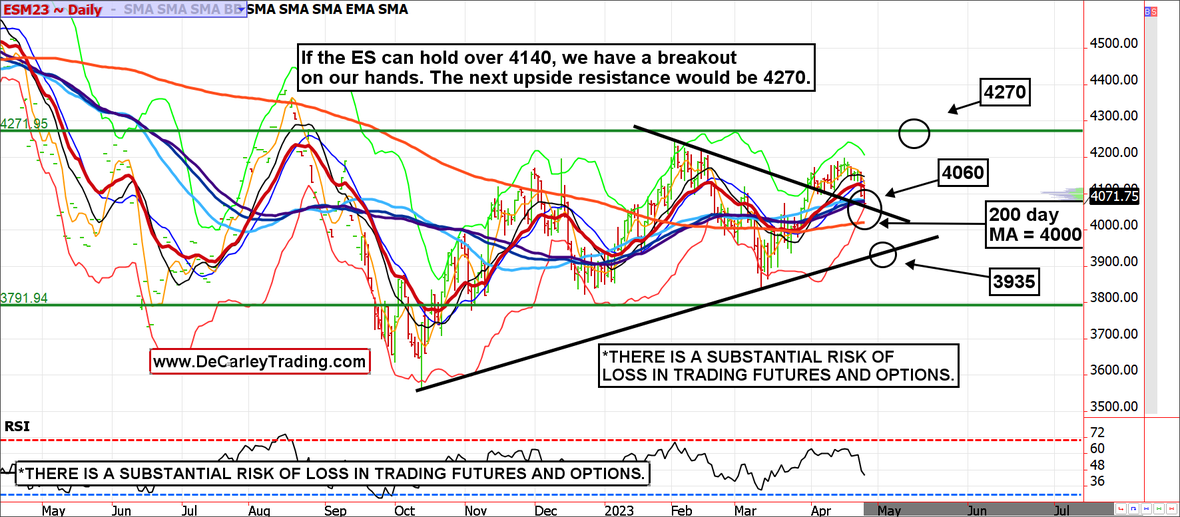
The ES is testing the breakout trendline
The S&P 500 broke out a few weeks ago but couldn't muster a full-on short-squeeze or FOMO rally. Nevertheless, the selling has been orderly, and we see several significant support levels on deck. The first will be 4060; this is the breakout trendline. A retest of this level is par for the course and could lure fresh buyers. But if 4060 fails, the 200-day moving average comes into play near 4000, and the uptrend line dating back to the October lows lies at 3935. Somewhere between here and 3935 support, should turn the tides back to the bulls based on market positioning.
Stock index futures market consensus
Earnings season hasn't been a disaster. With the masses short the market, this low bar is bullish.
Technical Support: 4060, 4000, 3935, 3790, 3600.
Technical Resistance: 4140, 4278 and 4450.
Author

Carley Garner
DeCarley Trading
Carley Garner is an experienced commodity broker with DeCarley Trading, a division of Zaner, in Las Vegas, Nevada. She is also the author of multiple books including, “Higher Probability Commodity Trading” and “A Trader's First Book on Commodities”.


