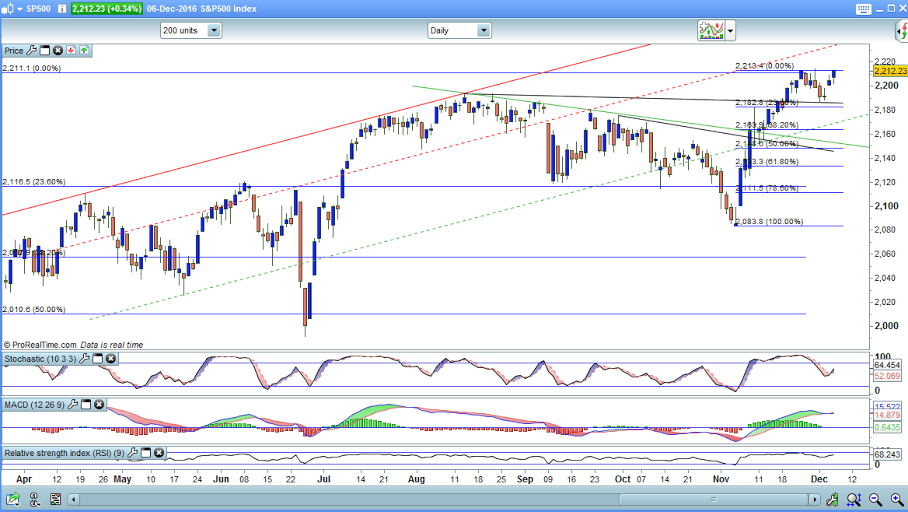
SUPPORT: 2205/04 2197/96 2193 2187 1277/75 2172 2162 2158/56 2152 2147/46

RESISTANCE: 2210 2214* 2220 2225 2243 2268 2289 2309 2323

Again ...we are grinding higher as we get nearer the 14th Dec...1 more week to go and we shall see where the market takes us....Now I know it is a difficult call when the market do look so strong....but there is still the buy the rumor ...sell the fact scenario going on...and I believe 2 things...1 is that the rate hike is already priced into the market...and if hiked...when will the next one be ?? If not for another year...Prices will fall....2...there wont be a rate hike...and the market will tank....because any credibility Yellen has will surely go put of the window....Also the stock markets are drastically overpriced with P/E ratios at nearly all time highs....so I think that the combined data we have will drive the price lower overall...Now obviously stock markets are not in a bear market...By nature stock markets are bullish which is why they make up such a large % of pension funds.....They are deemed " safe " in the long term....Its the short term corrections that kill...and please believe me when I say the stock markets are nervous.....Especially the US ones....Look at the Nasdaq....it id over 100 points off its ATH's...It is telling you something....The DJI is up there at ATH's...but it would be ....Its industrial....and Election was won ion promise to increase Industry across the US...so these 30 shares are holding up...because of the underlying natural demand for Industry.....The Nas being Technology is the forerunner of the US markets....and this is telling you a totally different story...The correction we are seeing in the Nas is making a bear flag....Bearish !!!!...so please if you are trading the S&P...look at the Nas....is it trading above 4825.....If not then it is going to trade lower....Resistance in S&P is at 2216 and again 2220 to 2225.

SP


The research provided by Charmer Charts is provided solely to enable clients to make their own investment decisions and does not constitute personal investment recommendations. No recommendations are made directly or indirectly by Technicalanalysisreports.com or Charmer Charts as to the merits or suitability of any investment decision or transaction that may result directly or indirectly from having viewed the technical analysis investment research. Customers are therefore urged to seek independent financial advice if they are in any doubt. The value of investments and the income derived from them can go down as well as up, and you may not get back the full amount you originally invested. Derivatives and foreign exchange trading are particularly high-risk, high-reward investment instruments and an investor may lose some or all of his or her original investment. Also, if you decide to acquire any investment denominated in a different currency you should note that changes in foreign exchange rates may have an adverse effect on the value, price and income of the investment in your own currency. Technicalanalysisreports.com or Charmer Charts shall not be liable for any direct or indirect, incidental or consequential loss or damage (including loss of profits, revenue or goodwill) arising from the use, inability to use, interruption or non-availability of the technical analysis investment research or any part of the research materials published or otherwise any loss of data on transmission, howsoever caused. Whilst the research material published is believed to be reliable and accurate, it is not independently verified. Accordingly, no representation or warranty is made or given by Technicalanalysisreports.com or Charmer Charts, its officers, agents or employees as to the accuracy or completeness of the same and no such person shall have liability for any inaccuracy in, or omission from, such materials.

Recommended Content


Recommended Content

Editors’ Picks

EUR/USD fluctuates near 1.0700 after US data

EUR/USD fluctuates near 1.0700 after US data

EUR/USD stays in a consolidation phase at around 1.0700 in the American session on Wednesday. The data from the US showed a strong increase in Durable Goods Orders, supporting the USD and making it difficult for the pair to gain traction.

EUR/USD News

USD/JPY refreshes 34-year high, attacks 155.00 as intervention risks loom

USD/JPY refreshes 34-year high, attacks 155.00 as intervention risks loom

USD/JPY is renewing a multi-decade high, closing in on 155.00. Traders turn cautious on heightened risks of Japan's FX intervention. Broad US Dollar rebound aids the upside in the major. US Durable Goods data are next on tap. 

USD/JPY News

Gold stays in consolidation above $2,300

Gold stays in consolidation above $2,300

Gold finds it difficult to stage a rebound midweek following Monday's sharp decline but manages to hold above $2,300. The benchmark 10-year US Treasury bond yield stays in the green above 4.6% after US data, not allowing the pair to turn north.

Gold News

Worldcoin looks set for comeback despite Nvidia’s 22% crash Premium

Worldcoin looks set for comeback despite Nvidia’s 22% crash

Worldcoin price is in a better position than last week's and shows signs of a potential comeback. This development occurs amid the sharp decline in the valuation of the popular GPU manufacturer Nvidia.

Read more

Three fundamentals for the week: US GDP, BoJ and the Fed's favorite inflation gauge stand out Premium

Three fundamentals for the week: US GDP, BoJ and the Fed's favorite inflation gauge stand out

While it is hard to predict when geopolitical news erupts, the level of tension is lower – allowing for key data to have its say. This week's US figures are set to shape the Federal Reserve's decision next week – and the Bank of Japan may struggle to halt the Yen's deterioration. 

Read more

Majors

Cryptocurrencies

Signatures