S&P500 rally not convincing: What can't go up, goes down

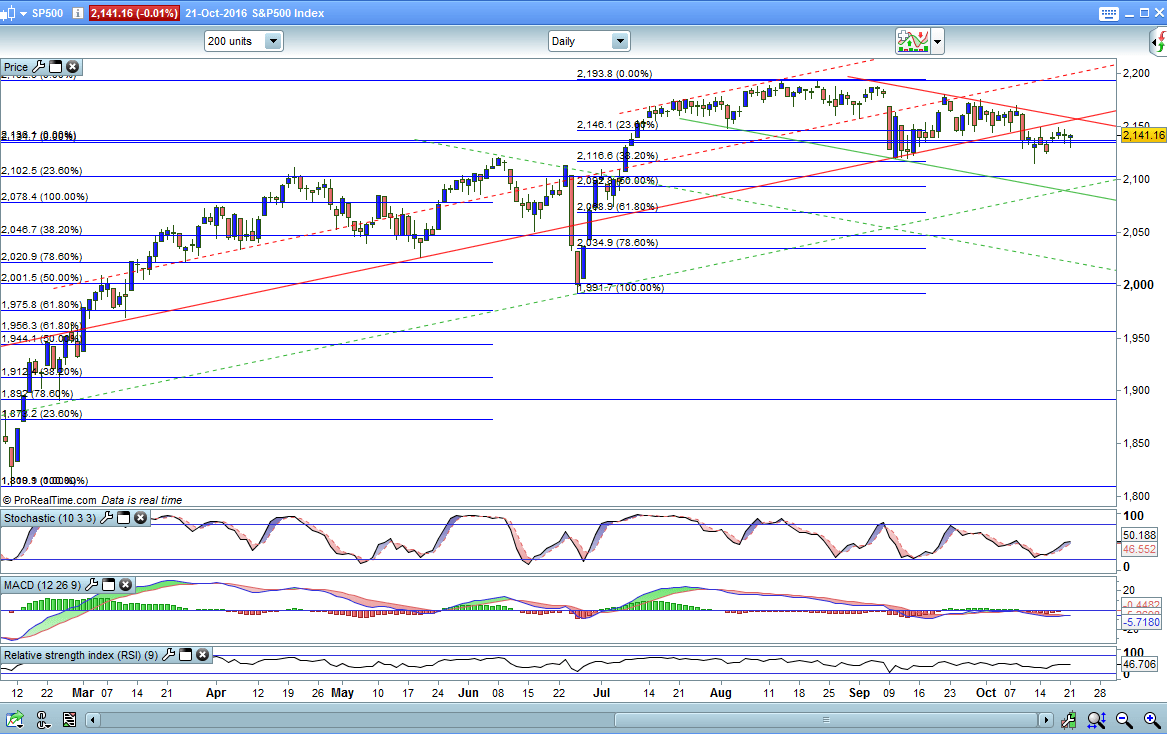
SUPPORT 2147/46 2139 2134 2126 2119 2116/14 2101/2099
RESISTANCE 2155 2162 2165 2175 2184 2193** 2199 2204*
Looking at the S&P over the past week....you can see that the down days actually have some volume...yet the up days have nothing and are closing basically where they opened....Now this isn't a technical observation....it is an observation...a gut feel if you like...when you have traded the S&P as long as I have you do get these feelings about it...and I just see that we have risen off oversold levels...but the price hasn't risen that far...2114 to 2148 and for this market it isn't far at all....So what does that tell me...It tells me that despite the rally...it has not been convincing...and what cannot go up...goes down..and I believe that we are going to head lower....I think that because the market has ow risen off oversold levels to neutral....that now is the time that we look to sell...we know we have resistance in the 2146/50 area...and we should be selling this strength with quite a short term stop at 2165.....This 2162 area sees 2 trendlines intersecting... and therefore I would expect some selling pressure coming in at these higher levels....so we sell the market to 2146/50...and look to add to 2162 and only reverse the trade if we break above 2165....On the downside we know we have between 2119 and 2114 as support so we are looking to cover all short positions here...Only if we lose 2112 would the market look a little weaker and then we see 2108 first but with greater potential for a move lower...I am looking at trendline support coming in at the 2085/75 area and this is where the big decision comes..
Author

Carol Harmer
Charmer Trading
Carol Harmer has over 39 years experience of analysing and trading the world's markets and is undoubtedly one of the most respected technical trader in the world today.


