S&P500: Neptune Vibrations

Chaos Clinic for 5/1/2020
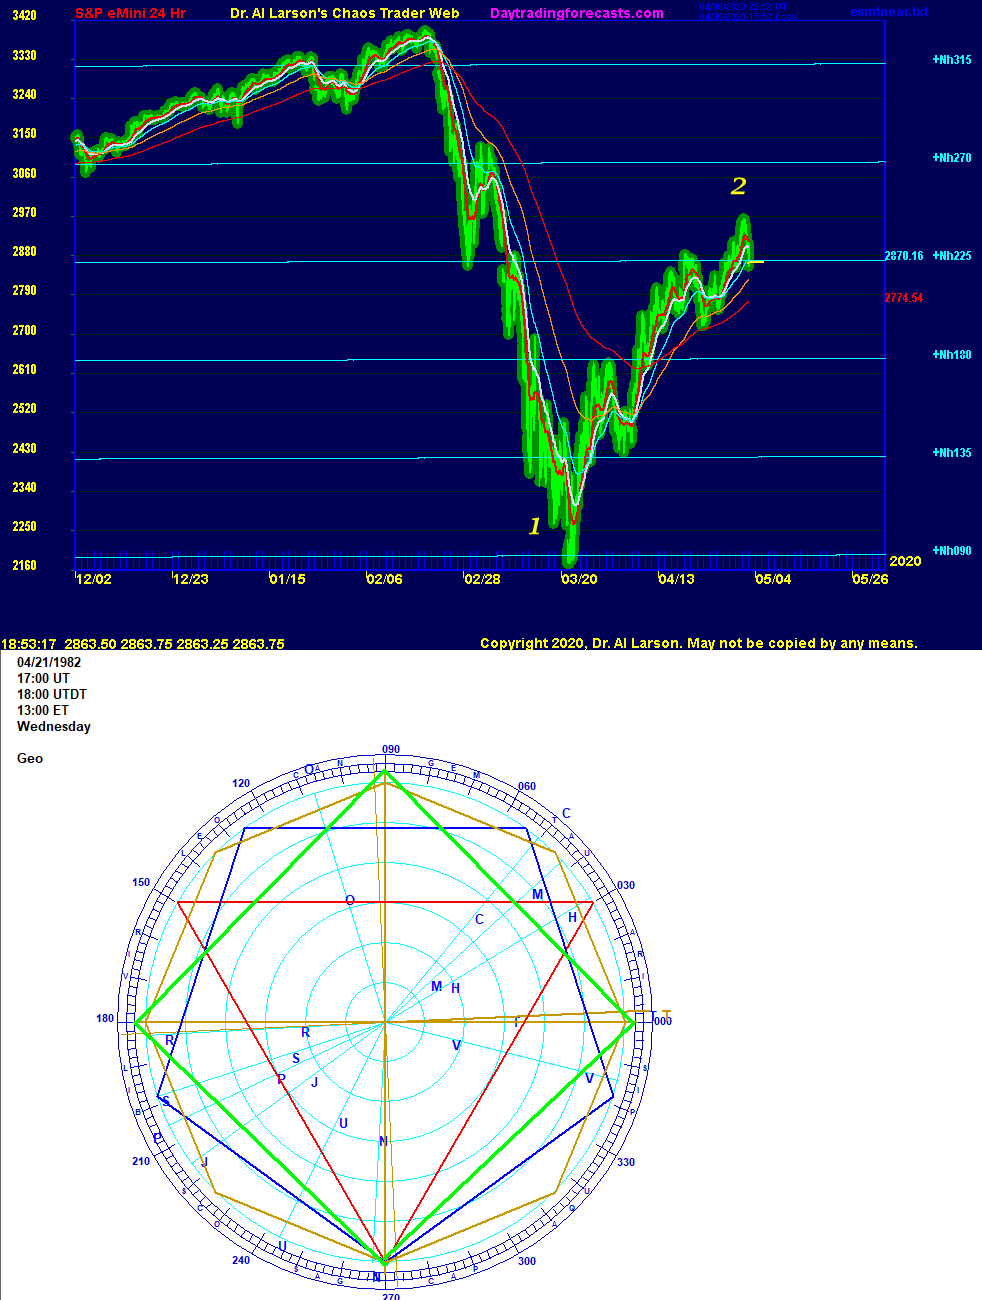
The top chart shows a plasma chart of the S&P, overlayed with heliocentric Neptune flux lines.
The flux lines are plotted every 45 degrees using a Wheel of 1800 scale. This scale is 5 times the Wheel of 360 scale that existed before COVID-19.
Markets have a "fractal fuzziness." Underlying that is a harmonic structure based on integer ratios. This shows up in this chart in the retracement ratios. The move 2 retracement was .642, a bit beyond the Fibonacci .618.
But in terms of the Neptune levels, the decline was down 5, up 3, the ratio of two integers, 3 and 5. The Fibonacci series is a seriesof intergers, starting with 1,2,3,5, and 8. So a a 3:5 ration fits. Energy adds together in integer ratios.
So why would Neptune electric field flux show up so strongly in the S&P? The answer is in the second chart, which is a natal ephemeris wheel for the S&P.
Neptune is very near the cardinal 270 degree position. Using this as a common point, there are harmonic relationships with several other natal planets.
Natal Sun is trine natal Neptune (red). Mars and Moon are square to it (green). Venus, Chiron, and Saturn are pentile to Neptune (blue). And Mercury is octile to Neptune. This octile creates frequency doubling with the square. Frequency doubling is a precursor to Chaos.
On the top chart, the Nh+315 level is 180 degrees to natal Mercury. The low of Nh+090 is natal Moon. The current Nh+225 is Mh+090. The intermediate level of bNh+135 is Mh+000, while the Nh+180 is both Tn+090 and Rn+270. So with the help of the plasma chart, which helps show the "fractal fuzz" and the ephemeris, the harmonic structure underlying the chaos is revealed.
The top chart looes like moves 1 and 2 of 7 in a down Chaos Clamshell.
This content was published on Dr. Al Larson's Chaos Clinic which you can attend each Friday for free.
Dr. Al Larson has developed a complete Chaos Model of Markets, four unique courses that let you become a Certified Chaos Trader, some very unique eMylar fractal pattern overlays, and tools that permit forecasting individual stocks and markets years in advance. You can also sign up for a free weekly email, and attend a free Chaos Clinic on Fridays. To learn more, click on the author's profile.
Be sure to sign up for the free weekly email!
Author

Dr. Al Larson, PhD
MoneyTide.com
Dr. Al Larson holds a Ph.D. in Electrical and Computer Engineering from the University of Wisconsin. He is a 1964 Distinguished Graduate of the U. S. Air Force Academy.


