S&P 500 Up 6% Since Year End, Stocks Continue Higher Despite Warning Signs

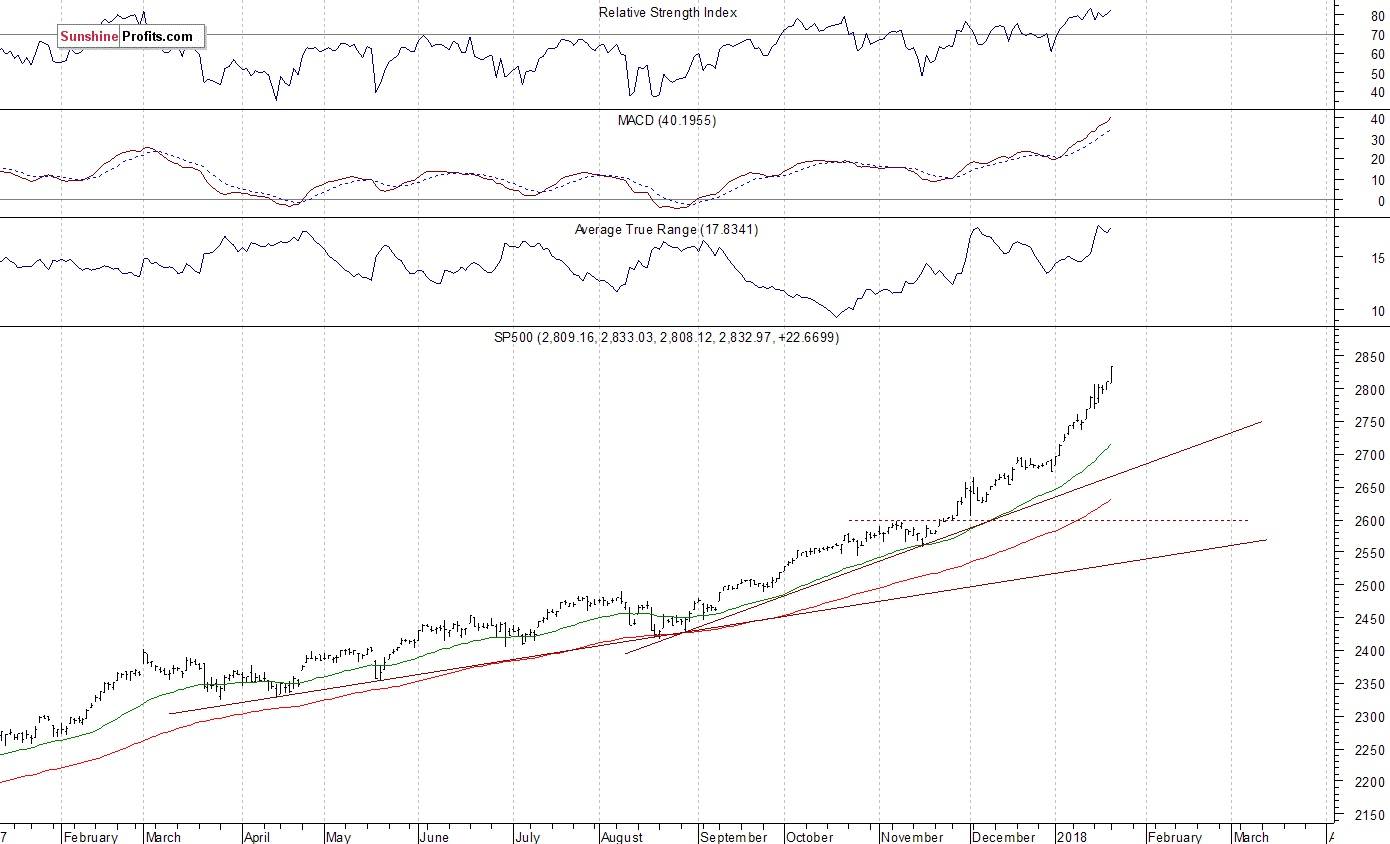
The U.S. stock market indexes gained 0.6-1.0% on Monday, extending their uptrend, as investors' sentiment remained very bullish. The S&P 500 index has reached new record high at the level of 2,833.03. It broke above its last week's short-term consolidation along the level of 2,800. The Dow Jones Industrial Average has also reached new record high at the level of 26,215.23. However, the blue-chip index was relatively weaker than the broad stock market. The technology Nasdaq Composite was relatively strong, as it gained 1.0% and reached new all-time high at 7,408.03. The nearest important level of support of the S&P 500 index is at 2,800-2,810, marked by previous resistance level. The next support level is at around 2,780, marked by recent local lows. The support level is also at 2,765-2,770, marked by the January 11 daily gap up of 2,767.56-2,769.64. We still can see medium-term technical overbought conditions along with negative technical divergences. However, the market continues to extend its nine-year-long bull market:
Mixed Expectations
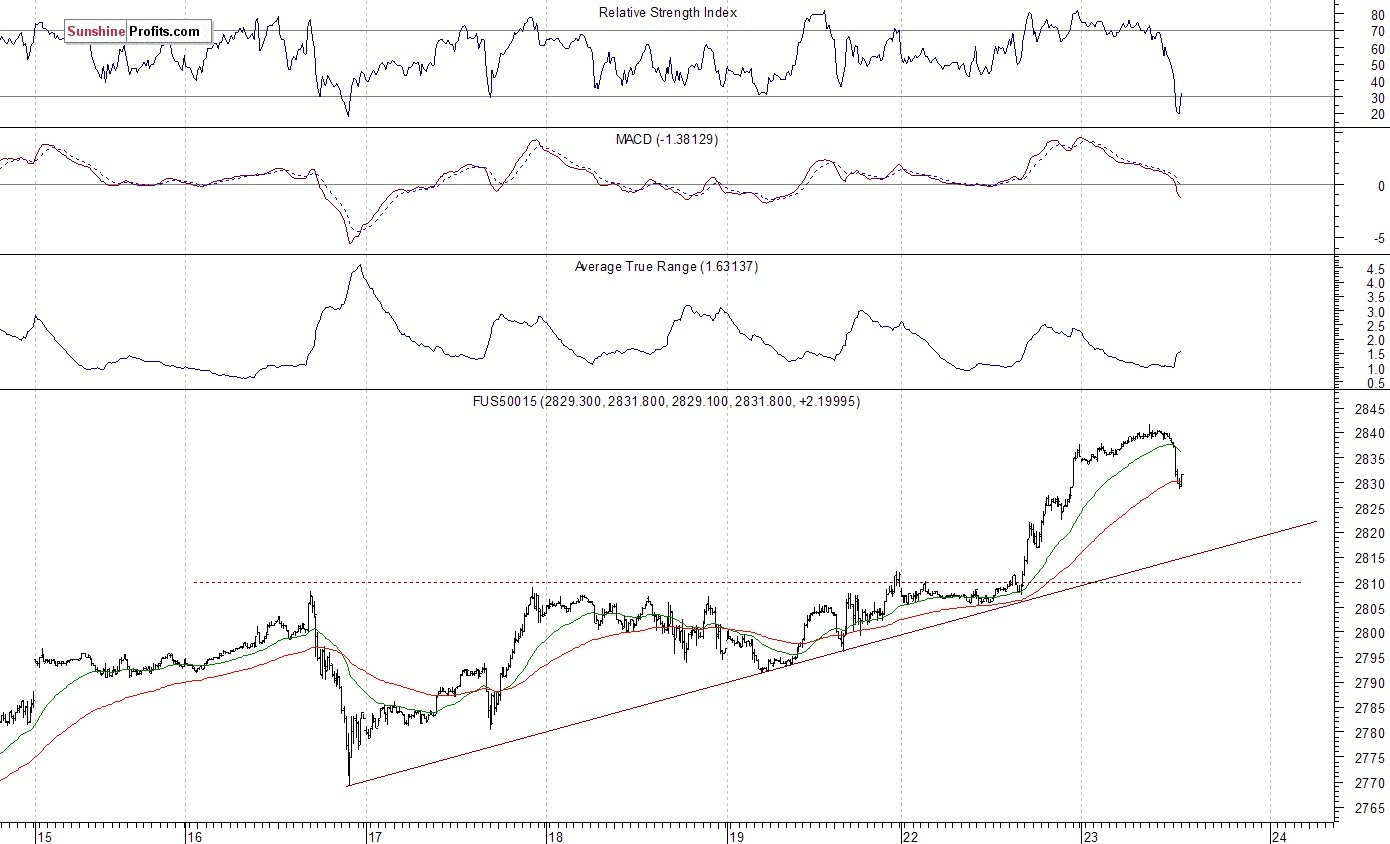
Expectations before the opening of today's trading session are virtually flat, with index futures currently between -0.1% and +0.1% vs. their yesterday's closing prices. The European stock market indexes have been mixed so far. There will be no new important economic data announcements today. The S&P 500 futures contract trades within an intraday downtrend following yesterday's rally. It retraces some of its overnight move up. The nearest important level of resistance is at around 2,840, marked by new record high. On the other hand, support level is at 2,825-2,830, marked by yesterday's intraday consolidation. The next level of support is at 2,800-2,810, marked by previous resistance level. The futures contract remains relatively close to its new record high, as the 15-minute chart shows:
Nasdaq Relatively Stronger
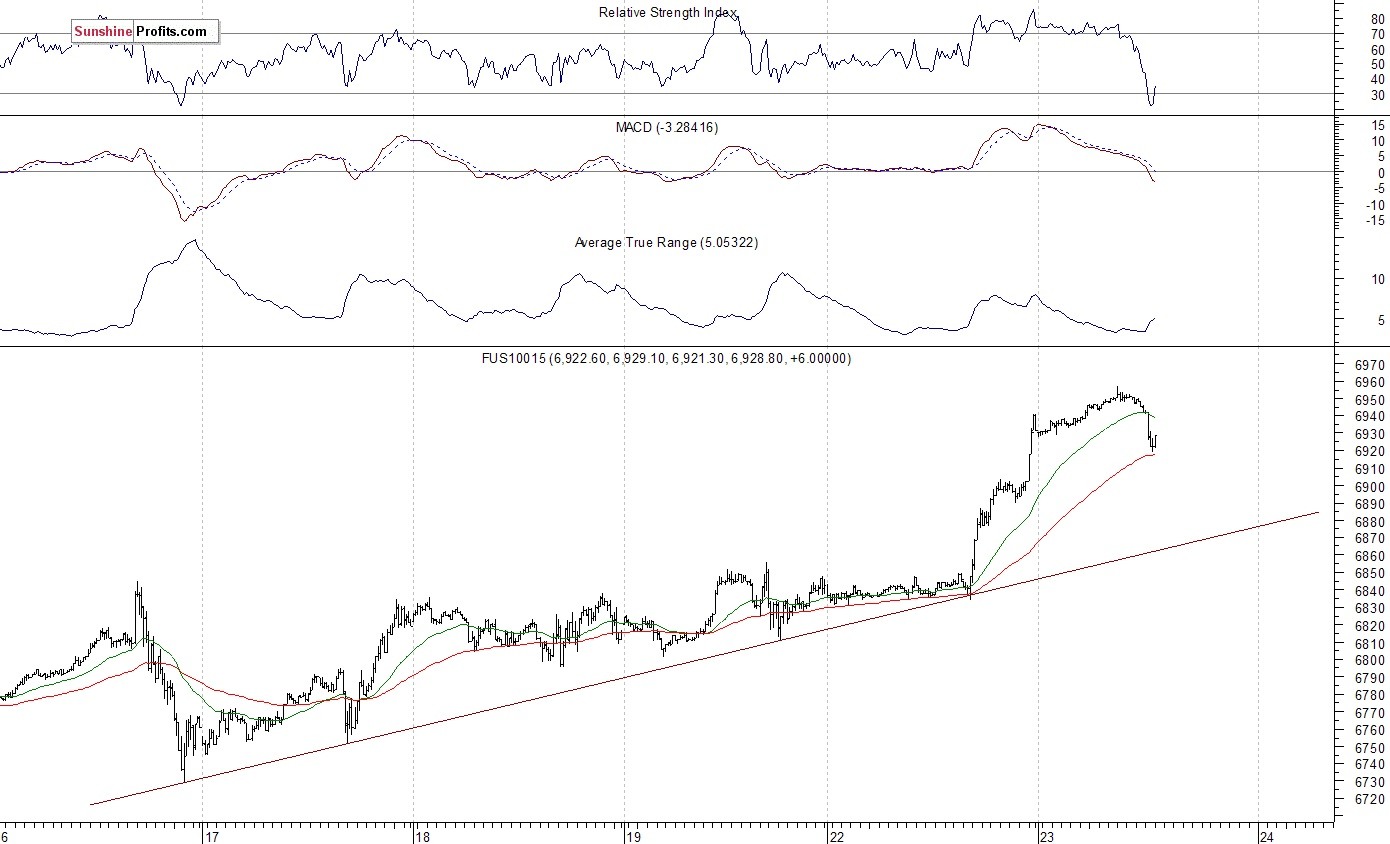
The technology Nasdaq 100 futures contract follows a similar path, as it retraces some of its overnight advance. It remains close to new all-time high following breakout above 6,900 mark. The nearest important level of resistance is at around 6,950-6,960. On the other hand, support level is at 6,880-6,900. The next level of support remains at 6,800-6,830, marked by some recent fluctuations. The Nasdaq 100 futures contract remains above its short-term upward trend line, as we can see on the 15-minute chart:
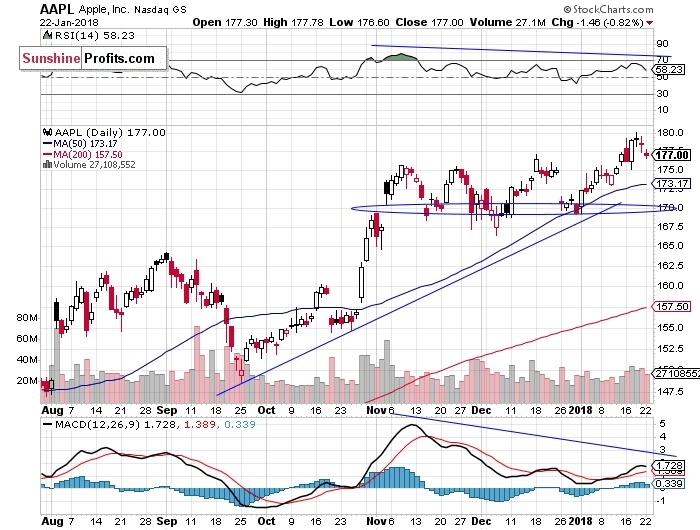
Let's take a look at Apple, Inc. stock (AAPL) daily chart (chart courtesy of http://stockcharts.com). The stock reached new record high on Thursday last week, following short-term consolidation along the support level of $175. The market got closer to $180 mark, but it failed to continue its short-term uptrend. We still can see some negative technical divergences. The most common divergences are between asset’s price and some indicator based on it (for instance the index and RSI based on the index). In this case, the divergence occurs when price forms a higher high and the indicator forms a lower high. It shows us that even though price reaches new highs, the fuel for the uptrend starts running low.
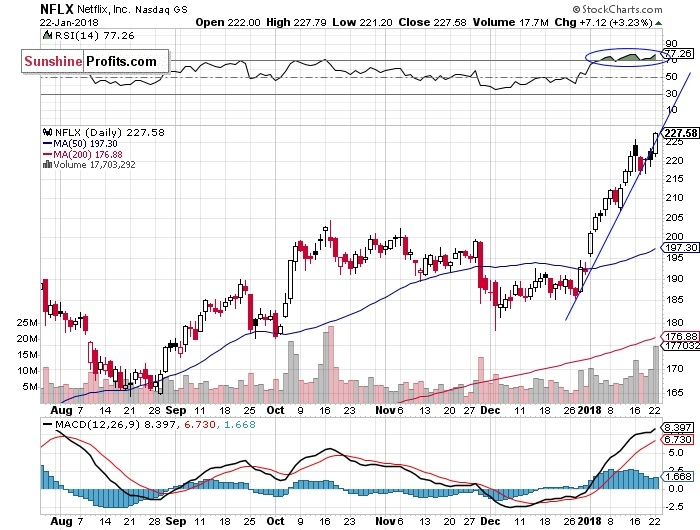
Netflix, Inc. stock (NFLX) was relatively stronger than the broad stock market yesterday. It accelerated its medium-term uptrend ahead of quarterly earnings announcement. The stock is expected to continue its bull run today, following better-than-expected earnings release. However, we can see some short-term overbought conditions. Potential resistance level is at around $250:
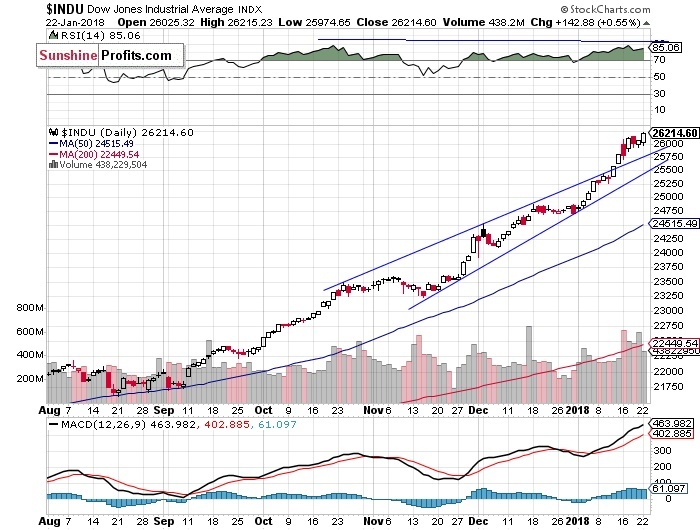
The Dow Jones Industrial Average daily chart shows that blue-chip index reached new record high yesterday, as it broke above its Thursday's high and continued breakout above 26,000 mark. We still can see some medium-term negative technical divergences. The index trades above its two-month-long rising wedge pattern (failed uptrend reversal pattern):
Concluding, the S&P 500 index gained 0.8% on Monday, as it accelerated its uptrend following breakout above last week's consolidation along the level of 2,800. The broad stock market continues its almost month-long bullish euphoria run. The index is currently trading 6% above its December 29 yearly closing price. Is this some medium-term topping pattern before uptrend reversal? There have been no confirmed negative signals so far. However, we still can see medium-term overbought conditions along with negative technical divergences.
Want free follow-ups to the above article and details not available to 99%+ investors? Sign up to our free newsletter today!
Author

Paul Rejczak
Sunshine Profits
Paul Rejczak is a stock market strategist who has been known for the quality of his technical and fundamental analysis since the late nineties.


