S&P 500: Rallying tech stocks vs. plummeting oil stocks

The S&P 500 index nearly topped its record high on Friday, but it closed lower following an intraday decline. Is this a topping pattern?
For in-depth technical analysis of various stocks and a recap of today's Stock Trading Alert we encourage you to watch today's video.
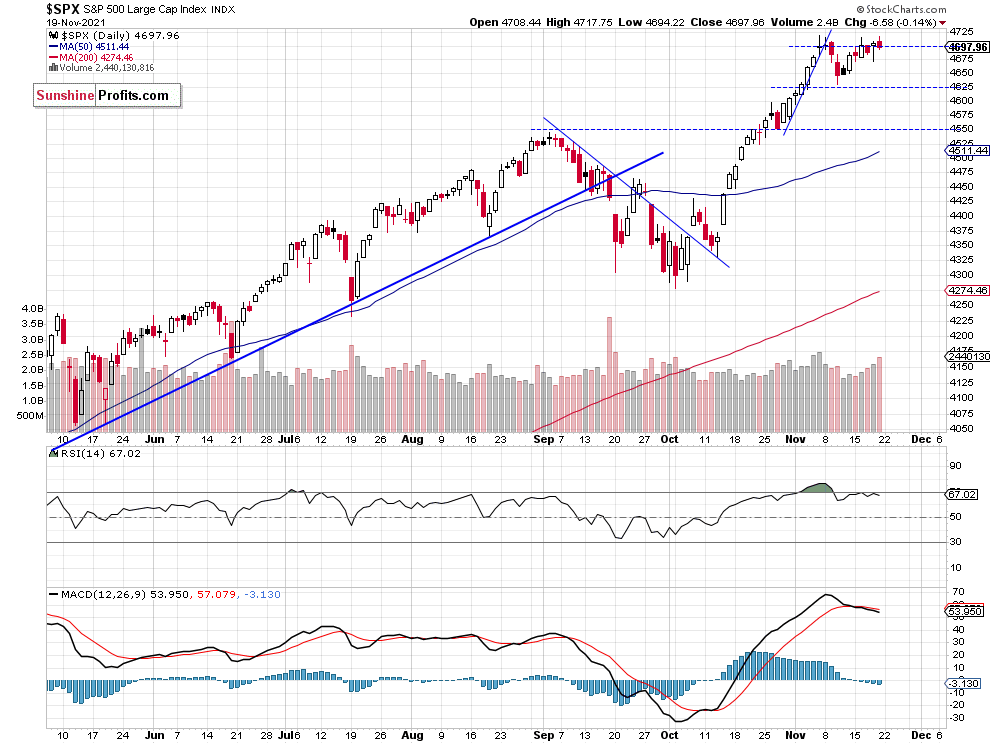
The S&P 500 index lost 0.14% on Friday, Nov. 19, as it extended its short-term consolidation along the 4,700 level. The broad stock market went sideways despite record-breaking rallies in large tech stocks like AAPL, MSFT and NVDA. It still looks like a short-term topping pattern, as the S&P 500 index keeps bouncing from the Nov. 5 record high of 4,718.50.
The nearest important support level remains at 4,630-4,650 and the next support level is at 4,600. On the other hand, the resistance level is at 4,700-4,720. The S&P 500 continues to trade along the 4,700 level, as we can see on the daily chart (chart by courtesy of stockcharts):
Nasdaq Reached the New Record High
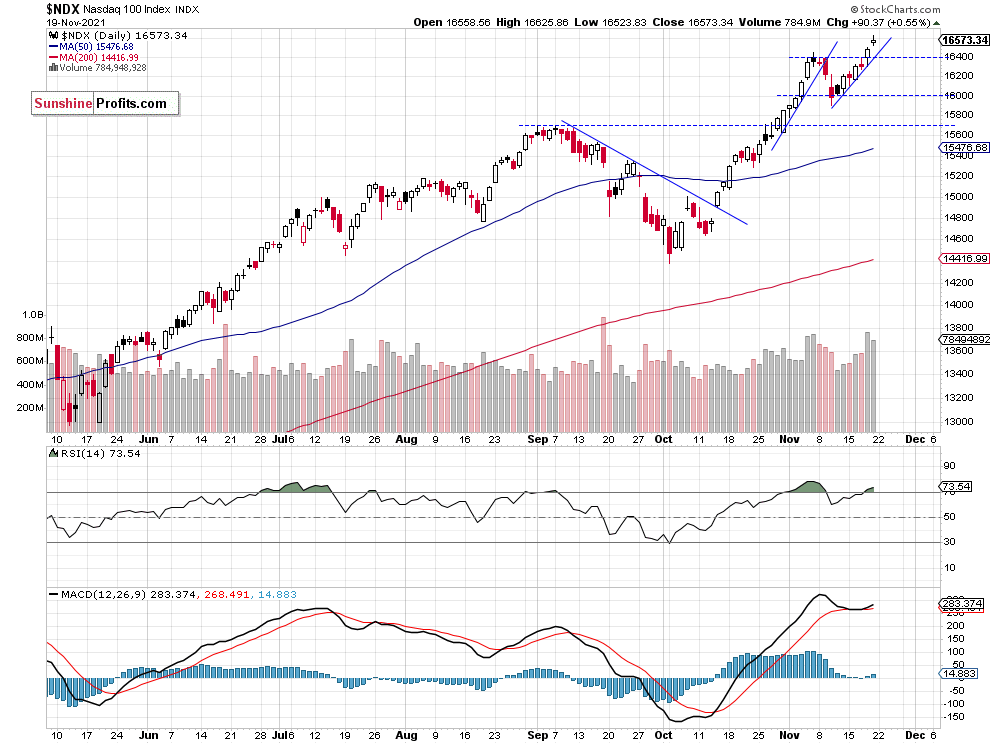
Let’s take a look at the Nasdaq 100 chart. The technology index reached the new record high of 16,625.86 on Friday, led by megacap tech stock rallies. It accelerated above its short-term upward trend line after breaking above the resistance level of 16,400 on Thursday. There have been no confirmed negative signals so far. However, we can see some short-term overbought conditions.
Apple and Microsoft at New Record Highs
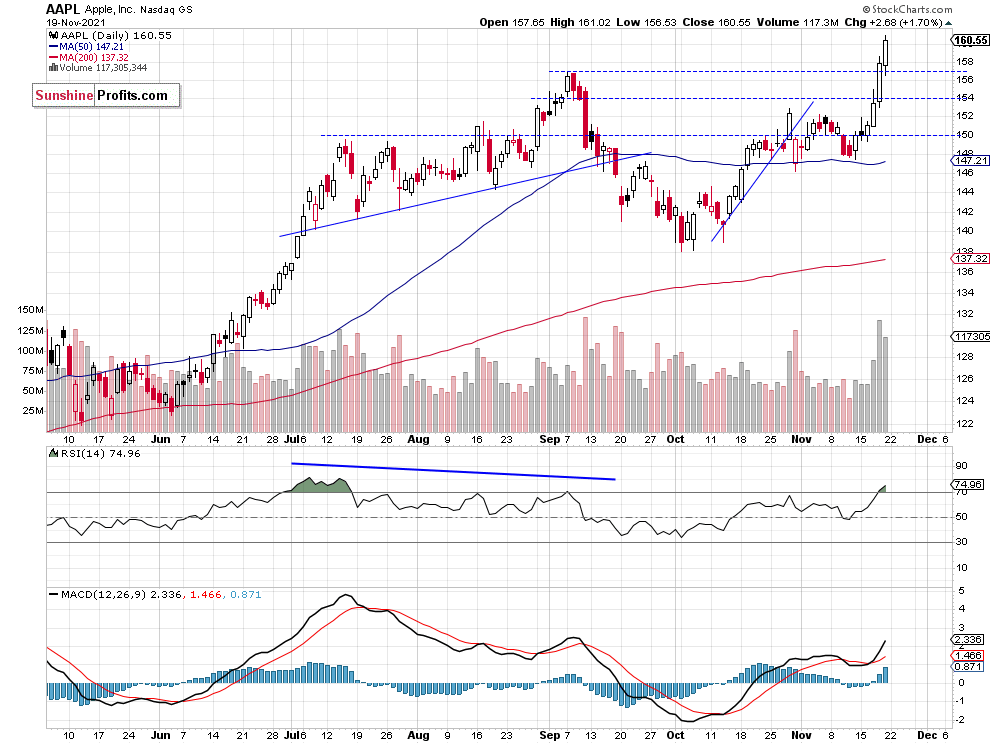
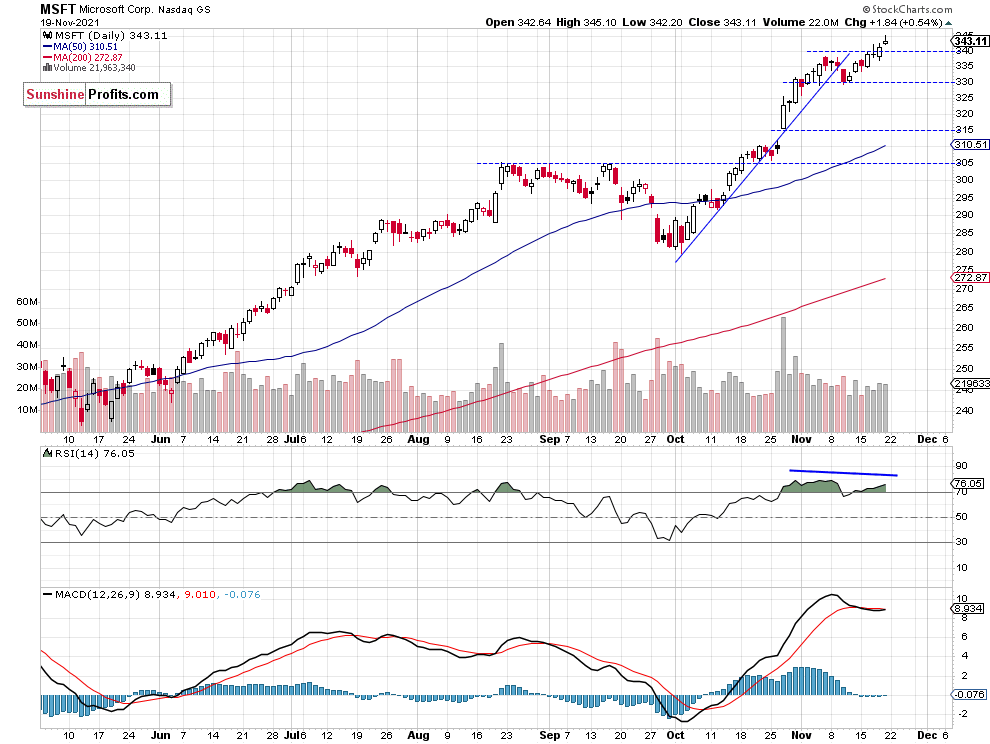
Let’s take a look at the two biggest stocks in the S&P 500 index, AAPL and MSFT. Apple accelerated its uptrend after breaking above the resistance level of around $152-154. It reached the new record high on Friday at $161.02. Microsoft slightly extended its recent advance, as it reached the new record high of $345.10. The two biggest megacap tech stocks reached new record highs, as we can see on their daily charts:
Conclusion
The S&P 500 index is expected to open 0.4% higher this morning. We will likely see some more short-term fluctuations along the record high level. For now, it looks like a short-term consolidation and a flat correction within an uptrend.
Here’s the breakdown:
- The S&P 500 is fluctuating along the 4,700 level. For now, it looks like a short-term consolidation following the October-November rally.
- Still no positions are justified from the risk/reward point of view.
Want free follow-ups to the above article and details not available to 99%+ investors? Sign up to our free newsletter today!
Want free follow-ups to the above article and details not available to 99%+ investors? Sign up to our free newsletter today!
Author

Paul Rejczak
Sunshine Profits
Paul Rejczak is a stock market strategist who has been known for the quality of his technical and fundamental analysis since the late nineties.


