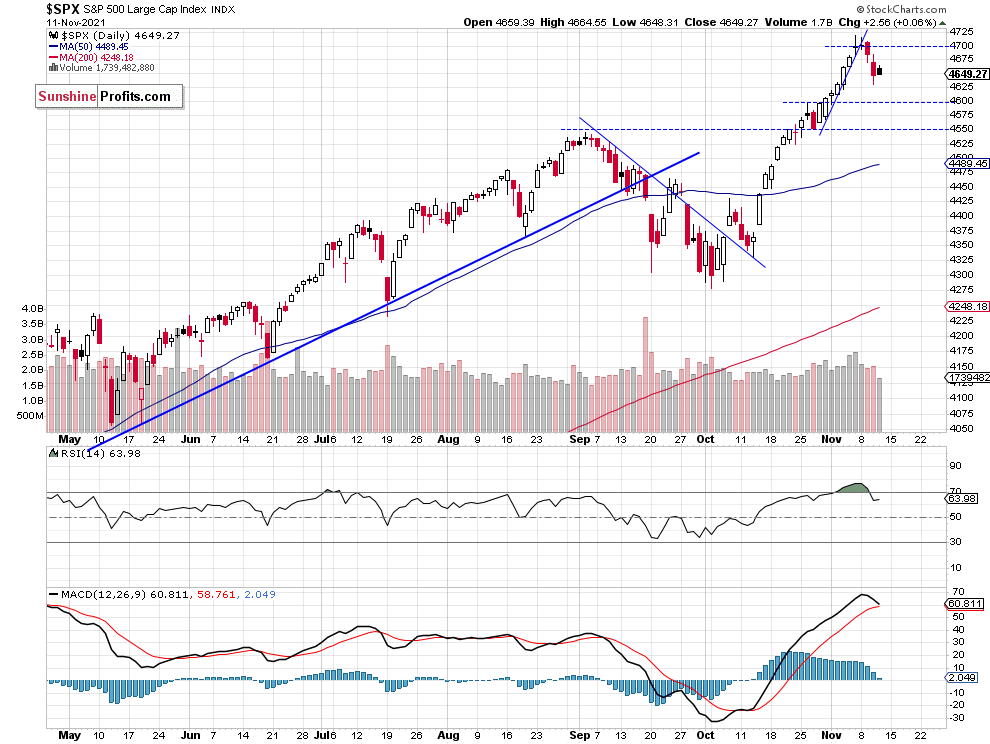
S&P 500: More short-term uncertainty as trading range narrows

The S&P 500 index went sideways on Thursday following a decline from its last week’s high. Is the downward correction over?
The S&P 500 index gained 0.06% on Thursday, as it fluctuated along the 4,650 level. On Wednesday it fell to the local low of 4,630.86 and it was almost 88 points or 1.86% below the last week’s Friday’s record high of 4,718.50.
The recent rally was not broad-based and it was driven by a handful of tech stocks like MSFT, NVDA, TSLA. The market seemed overbought in the short-term and traded within a topping pattern. Today the index may extend a short-term consolidation.
The nearest important support level remains at 4,630-4,650 and the next support level is at 4,600. On the other hand, the resistance level is at 4,700-4,720. The S&P 500 broke below its steep short-term upward trend line, as we can see on the daily chart:
Nasdaq’s Downward Correction
Let’s take a look at the Nasdaq 100 chart. The technology index broke above the 16,000 level last week and on Friday it was trading at the new record high. The market accelerated higher above its short-term upward trend line. But since then it has been retracing the rally. The resistance level remains at 16,400, and the short-term support level is at 16,000, among others, as we can see on the daily chart:

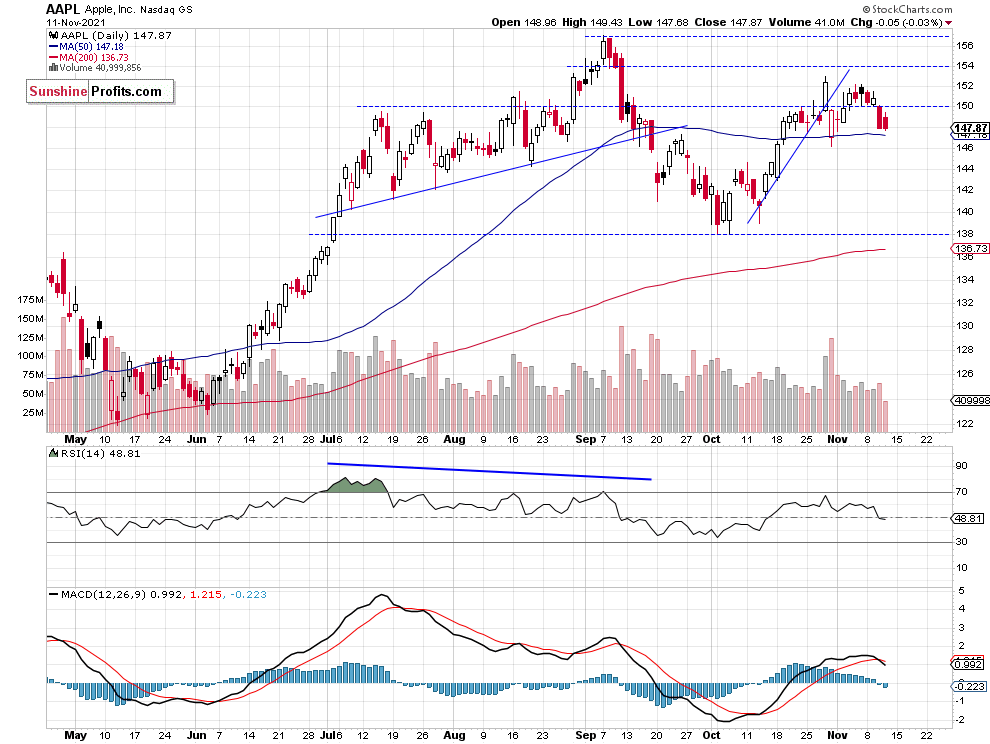
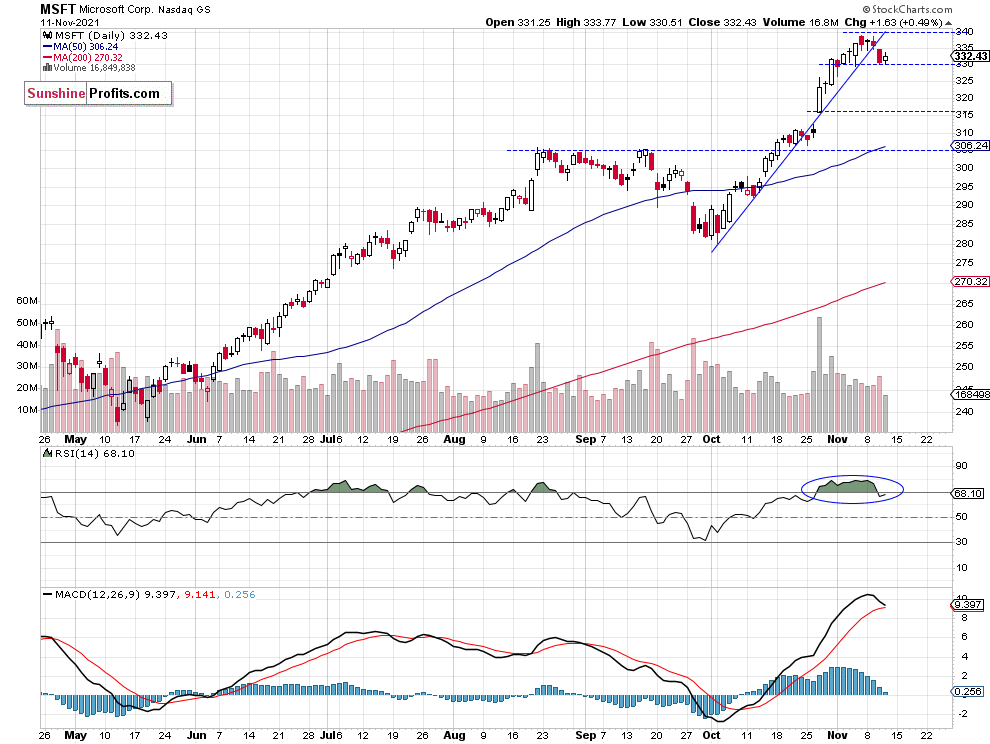
Apple Remains Relatively Weak, Microsoft Breaks Below the Trend Line
Let’s take a look at the two biggest stocks in the S&P 500 index, AAPL and MSFT. Apple came back below the $150 price level. It is still well below the early September record high. Microsoft stock was reaching new record highs recently but on Wednesday it broke below its upward trend line. So the megacaps tech stocks turned lower, as we can see on their daily charts:
Conclusion
The S&P 500 index was little changed on Thursday and today it is expected to retrace some of its recent declines. So is the downward correction over? For now, there has been no confirmed short-term upward reversal and we may see some more consolidation below the 4,700 mark. The market may go sideways today, as investors keep taking short-term profits off the table following the recent economic and quarterly corporate earnings releases.
Here’s the breakdown:
- The S&P 500 retraced some of its record-breaking rally in the last few trading sessions – for now it looks like a downward correction.
- Still no positions are justified from the risk/reward point of view.
Want free follow-ups to the above article and details not available to 99%+ investors? Sign up to our free newsletter today!
Author

Paul Rejczak
Sunshine Profits
Paul Rejczak is a stock market strategist who has been known for the quality of his technical and fundamental analysis since the late nineties.


