S&P 500 futures accelerated to the downside, breaking the 4400 level

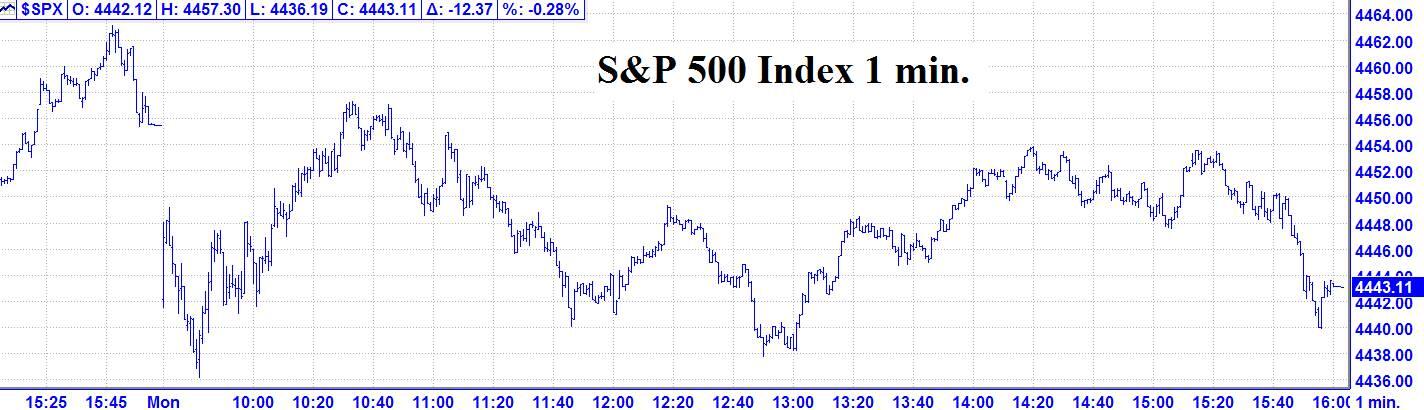
9/27 Recap: - The S&P opened with a 14 handle gap down and then traded another 6 handles lower into a 9:42 AM low of the day. From that low, the S&P rallied 22 handles into a 10:33 AM high. From that high, the S&P declined 17 handles into an 11:46 AM low. From that low, there was a 9 handle bounce into an 12:18 PM high. From that high, the S&P pulled back 11 handles into a 1:00 PM low. From that low, the S&P rallied 16 handles into a 2:20 PM high. From that high, the S&P pulled back 6 handles into a 3:06 PM low. From that low, the S&P bounced 6 handles into a 3:14 PM high. From that high, the S&P declined 12 handles into the close.
9//27 - The DJIA had a small up day while the S&P 500 and the Nasdaq Composite had moderate down days with the following
Closes: The DJIA + 71.37, the S&P 500 Index -12.37 and the Nasdaq Composite – 77.73.
Looking ahead – Over Sunday night, the December S&P Emini futures rallied to a peak at 4472.00. Recently the spread between the futures and the cash S&P 500 Index has been averaging about 7 handles, with the futures under the actual index. If we add 7 to the high on the futures of 4472.00, that implies that had if the S&P 500 Index been trading, it would have made a peak at 4479.00, which is just 4 handles from our 4483 potential target. Monday, we had a modest decline and then a rally into about 2:00 AM EDT Tuesday morning. From that peak the S&P futures accelerated to the downside, breaking the 4400 level. If this down trend follows thru Tuesday morning, there is a good chance this down trend will continue for the rest of this week.
The NOW Index is in the NEUTRAL ZONE.
Coming events
(Stocks potentially respond to all events).
4. B. 10/01 AC – Venus Aphelion. Major change in trend Cattle, Copper, Corn, Cotton, Gold, OJ, Sugar, Wheat.
Stock market key dates
Astro – 9/27, 10/1 AC.
Please see below the S&P 500 10 minute chart.
Support - 4370 Resistance – 4440.

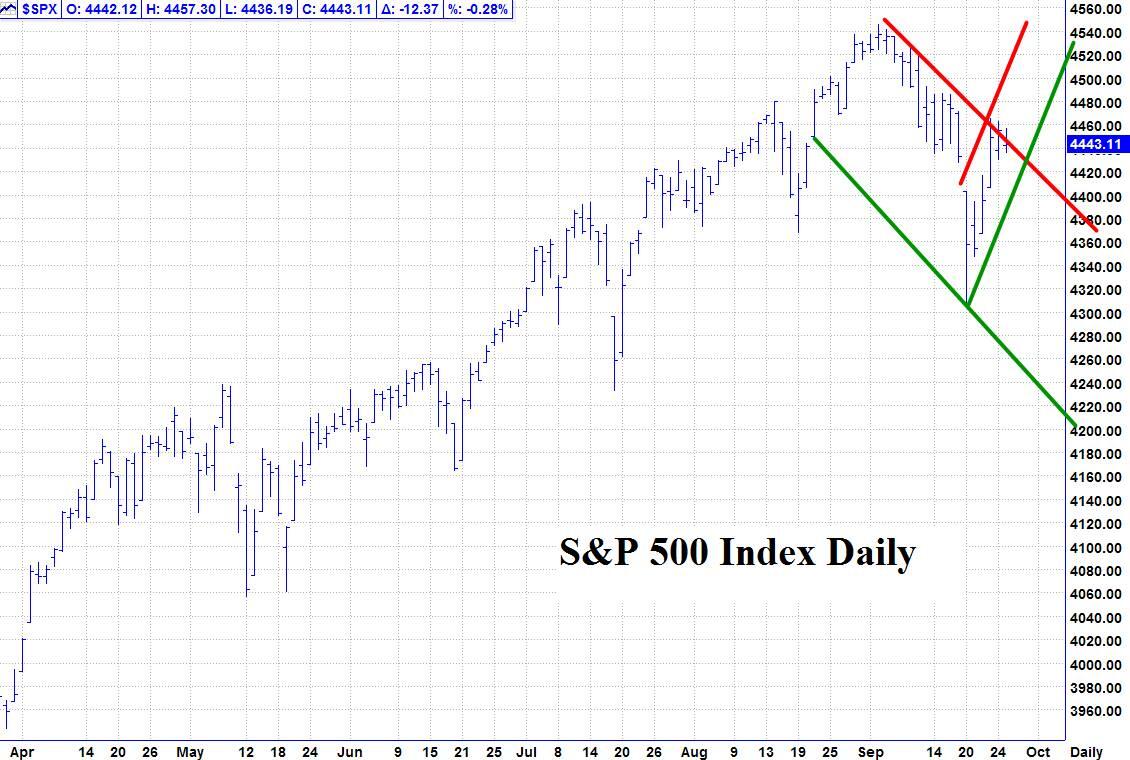
Please see below the S&P 500 Daily chart.
Support - 4370 Resistance – 4440.
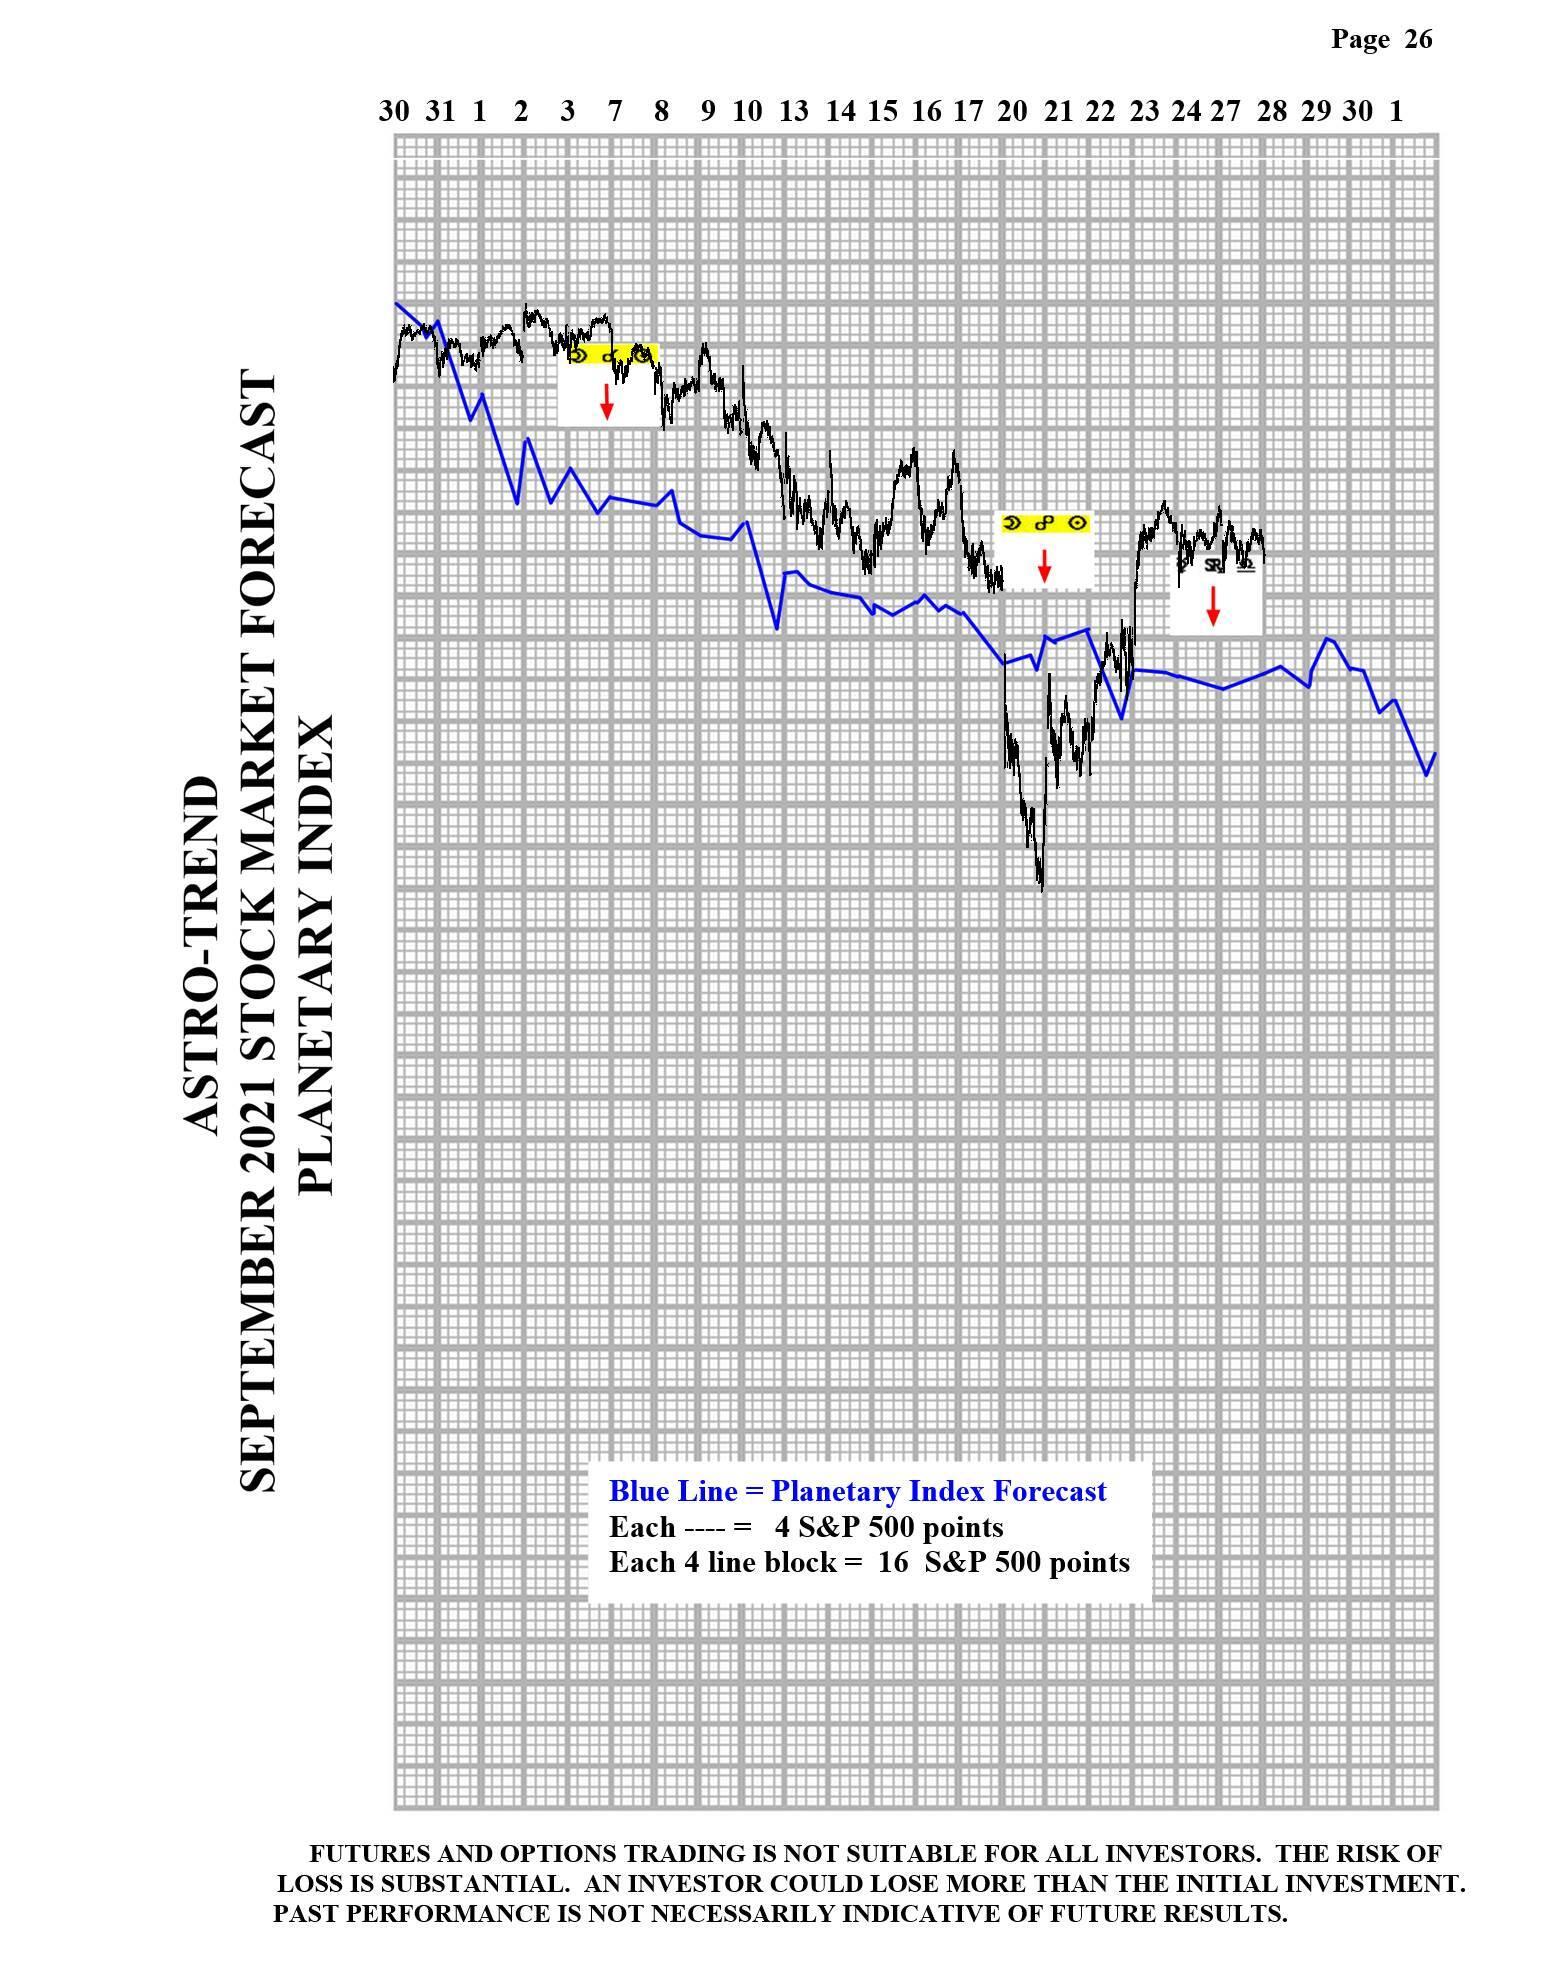
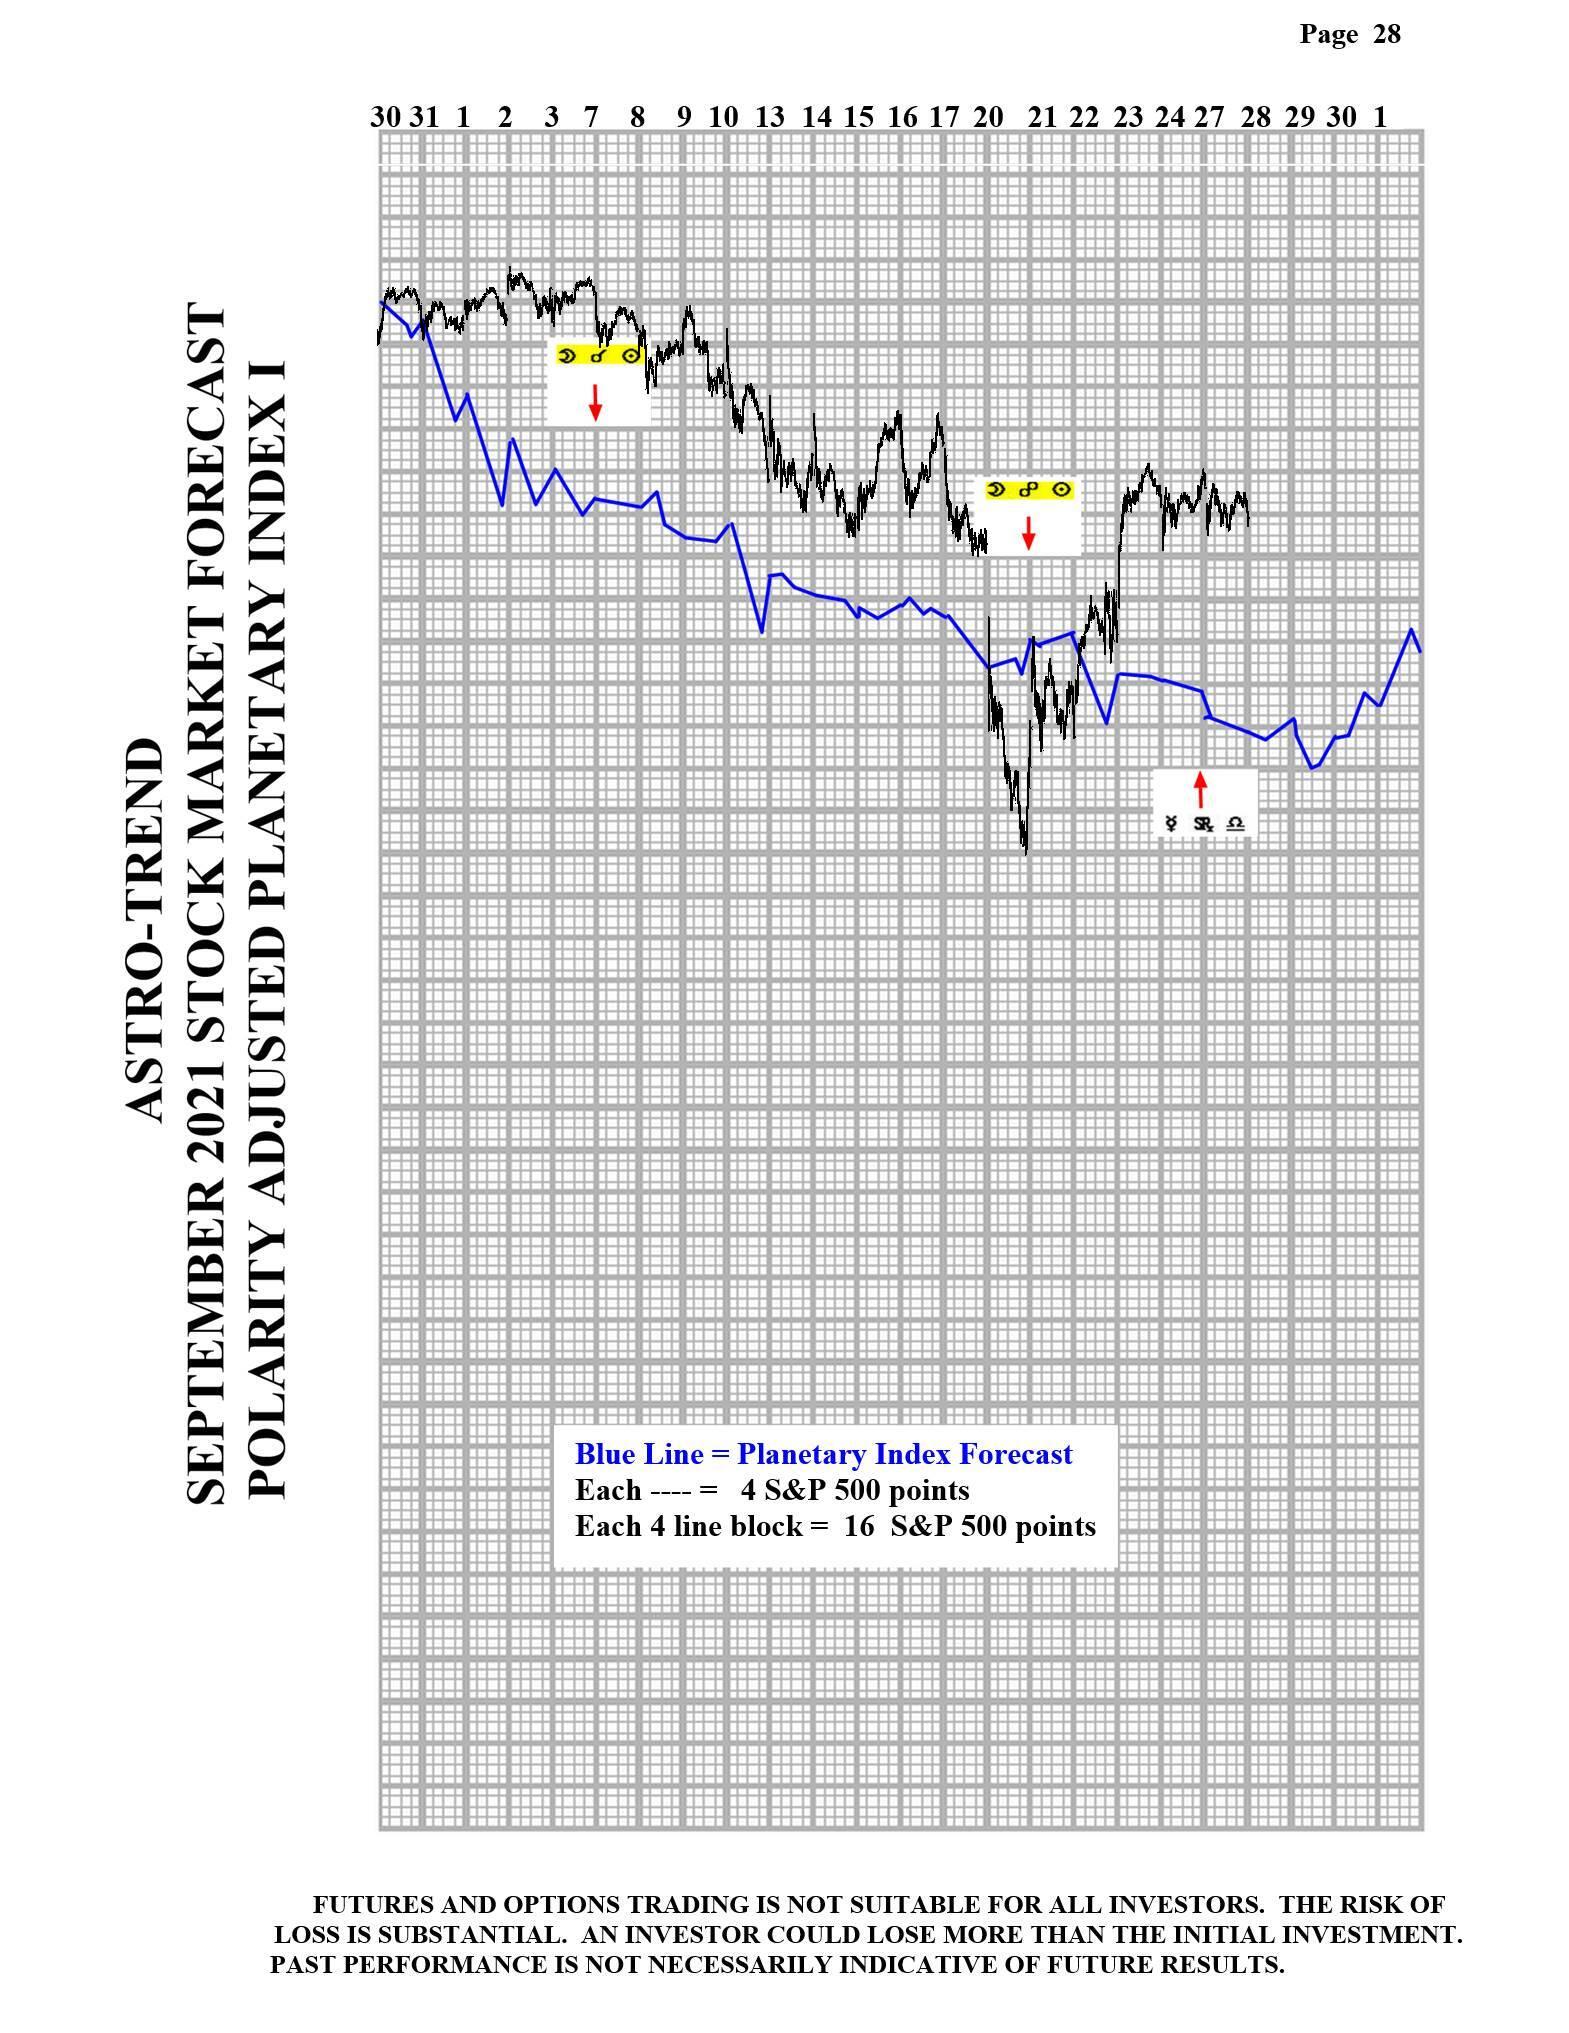
Please see below the Planetary Index charts with S&P 500 10 minute bars for results.
As of 9/24 we are dropping the charts market Pages 27 and Page 29.
Author

Norm Winski
Independent Analyst
www.astro-trend.com


