Smart money pumps markets [Video]
![Smart money pumps markets [Video]](https://editorial.fxstreet.com/images/Macroeconomics/FlowFunds/MoneySupply/withdraw-money-in-banknotes-from-an-atm-gm499448991-42641844_XtraLarge.jpg)
US Dollar: Sep '22 USD is Up at 106.635.
Energies: Sept '22 Crude is Down at 89.20.
Financials: The Sep '22 30 Year bond is Down 6 ticks and trading at 141.11.
Indices: The Sep '22 S&P 500 emini ES contract is 27 ticks Lower and trading at 4292.00.
Gold: The Dec'22 Gold contract is trading Down at 1791.40. Gold is 67 ticks Lower than its close.
Initial conclusion
This is not a correlated market. The dollar is Up, and Crude is Down which is normal, but the 30-year Bond is trading Lower. The Financials should always correlate with the US dollar such that if the dollar is lower, then the bonds should follow and vice-versa. The S&P is Lower, and Crude is trading Lower which is not correlated. Gold is trading Lower which is correlated with the US dollar trading Up. I tend to believe that Gold has an inverse relationship with the US Dollar as when the US Dollar is down, Gold tends to rise in value and vice-versa. Think of it as a seesaw, when one is up the other should be down. I point this out to you to make you aware that when we don't have a correlated market, it means something is wrong. As traders you need to be aware of this and proceed with your eyes wide open. Asia is trading mainly Lower with the exception of the Shanghai and Sensex exchanges which are trading Higher. Currently all of Europe is trading Higher.
Possible challenges to traders today
-
Building Permits is out at 8:30 AM EST. Major.
-
Housing Starts is out at 8:30 AM EST. Major.
-
Capacity Utilization Rate is out at 9:15 AM EST. Major.
-
Industrial Production is out at 9:15 AM EST. Major.
Treasuries
Traders, please note that we've changed the Bond instrument from the 30 year (ZB) to the 10 year (ZN). They work exactly the same.
We've elected to switch gears a bit and show correlation between the 10-year bond (ZN) and the S&P futures contract. The S&P contract is the Standard and Poor's, and the purpose is to show reverse correlation between the two instruments. Remember it's likened to a seesaw, when up goes up the other should go down and vice versa.
Yesterday the ZN made its move at around 8 AM EST. The ZN hit a Low at around that time and the S&P moved Lower shortly thereafter. If you look at the charts below ZN gave a signal at around 8 AM EST and the S&P moved Lower at around the same time. Look at the charts below and you'll see a pattern for both assets. ZN hit a Low at around 8 AM EST and the S&P was moving Lower shortly thereafter. These charts represent the newest version of MultiCharts and I've changed the timeframe to a 15-minute chart to display better. This represented a Long opportunity on the 10-year note, as a trader you could have netted about 20 plus ticks per contract on this trade. Each tick is worth $15.625. Please note: the front month for the ZN is now Sep '22. The S&P contract is also Sep' 22 as well. The front months are now Sep' 22. I've changed the format to Renko Bars such that it may be more apparent and visible.
Charts courtesy of MultiCharts built on an AMP platform
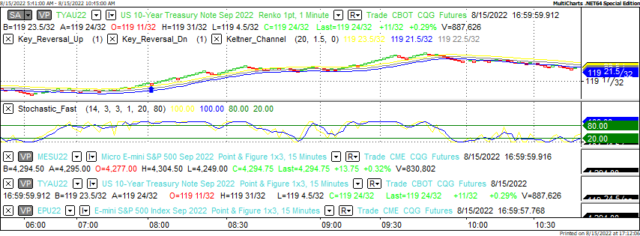
ZN - Sep 2022 - 08/15/22
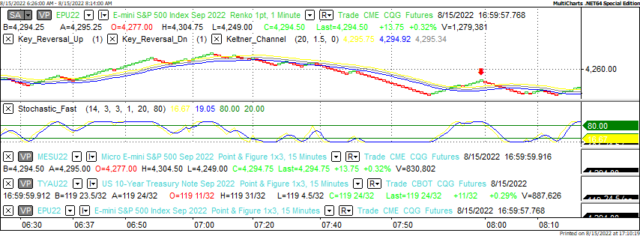
S&P - Sep 2022 - 08/15/22
Bias
Yesterday we gave the markets a Downside bias as both the USD and the Bonds were trading Higher Monday morning and that usually reflects a downside day. The markets had other ideas as the Dow gained 151 points and the other indices traded Higher as well. Today we aren't dealing with a correlated market and our bias is Neutral.
Could this change? Of Course. Remember anything can happen in a volatile market.
Commentary
Yesterday morning we arise and see that the markets are indeed correlated to the Downside and as such we gave the markets a Downside bias. Economic news is released that is NOT stellar. Empire State Manufacturing Index comes in at minus 31.3. Yes, I said minus. NAHB Housing Market Index comes in at 49 versus 55 expected. These are not good numbers, yet the markets rise. There can only be one explanation for this. The institutionals aka the Smart Money decided to go long the markets and prop it up. Think this is far-fetched? During the dark days of 2009 there was a phenomenon called teh Plunge Protection Team otherwise known as PPT. Every day at a certain time of the day you would the markets edge up based on nothing at all and the only entity that could do that are the Smart Money as they have billions to buy and sell with. When they make trades, they don't buy a handful of contracts, they buy and sell thousands at a clip because they have the capital to do so. Do they do this all the time? I don't think so as in recent years they didn't have to. The markets behaved exactly as they wanted it to but when we see things liken to yesterday, it makes you wonder.
Author

Nick Mastrandrea
Market Tea Leaves


