Small moves in the markets and big signals

Something important is about to happen next week...
It’s a really exciting week ahead of us, even though many investors don’t realize what’s really happening here.
The key things that are currently in play right now are:
- The likely reversal in stocks.
- The final verification of the inverse head-and-shoulders bottom in the USD Index.
- Copper’s final top not just due to the fundamental situation (the “why” behind it all), but also due to the very strong seasonal tendencies in both of them.
Gold hits textbook correction target
We see a correction in the precious metals sector today (just as the USD Index is somewhat lower), but this doesn’t change anything.
Let’s start with gold.
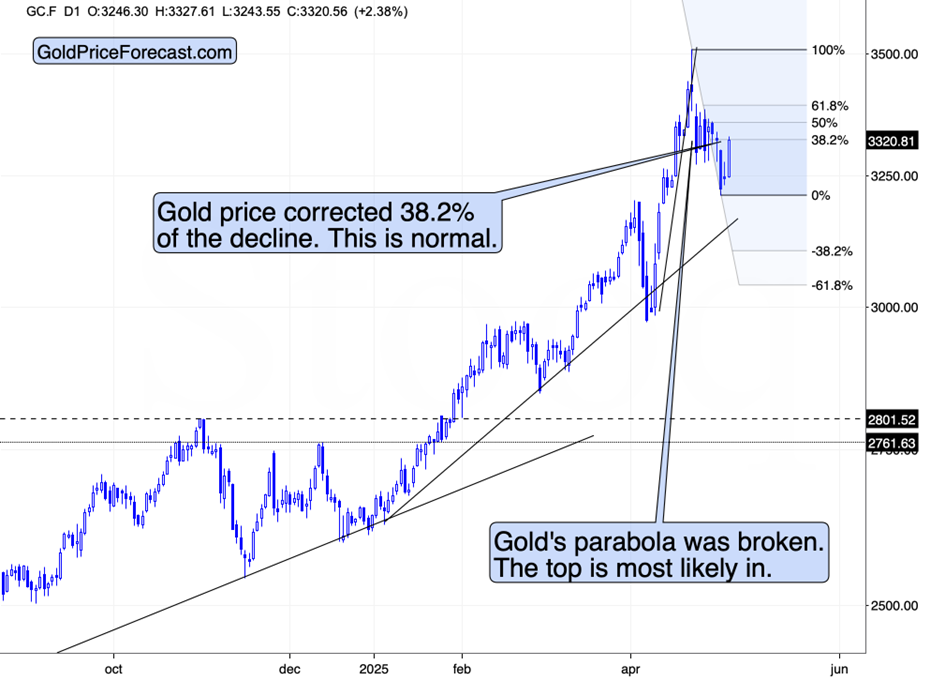
The yellow precious metal simply corrected to its 38.2% Fibonacci retracement. This is normal; those with gold in their retirement accounts have likely barely noticed any change. In fact, the 38.2% is often described as the minimum likely corrective target.
We’re likely seeing this correction as Trump once again called for lower interest rates.
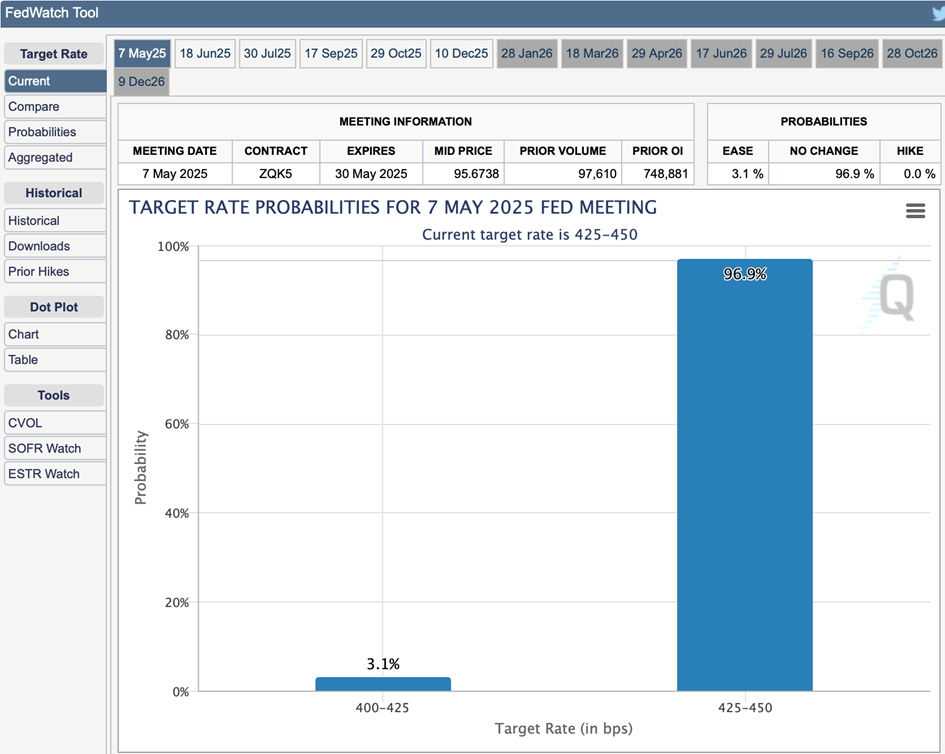
According to the CME FedWatch Tool, the expectations are for the rates to stay where they are, but many investors might be reacting more emotionally here. That’s why gold might have corrected. And that’s why the USD Index might have once again moved lower testing the neck level of the previous inverse head and shoulders pattern.
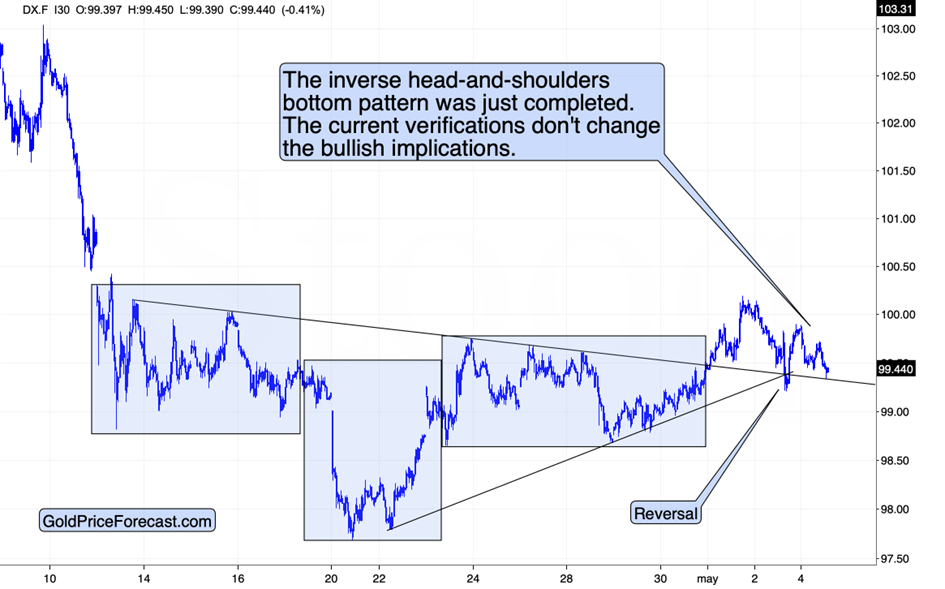
The key thing here, however, is that this line was NOT broken. It held.
When previously Trump criticized Powell and called for lower rates, the USD Index declined profoundly. This is NOT the case today. It’s just a pullback to the previous resistance level that now proved to be support. This was a test, and the USD Index passed it. This is bullish, and it implies that a move higher here is likely.
Most importantly, let’s keep in mind that the above is just a tiny, short-term confirmation that comes on top of the major, long-term analogy to 2018 and massive support levels that just held.
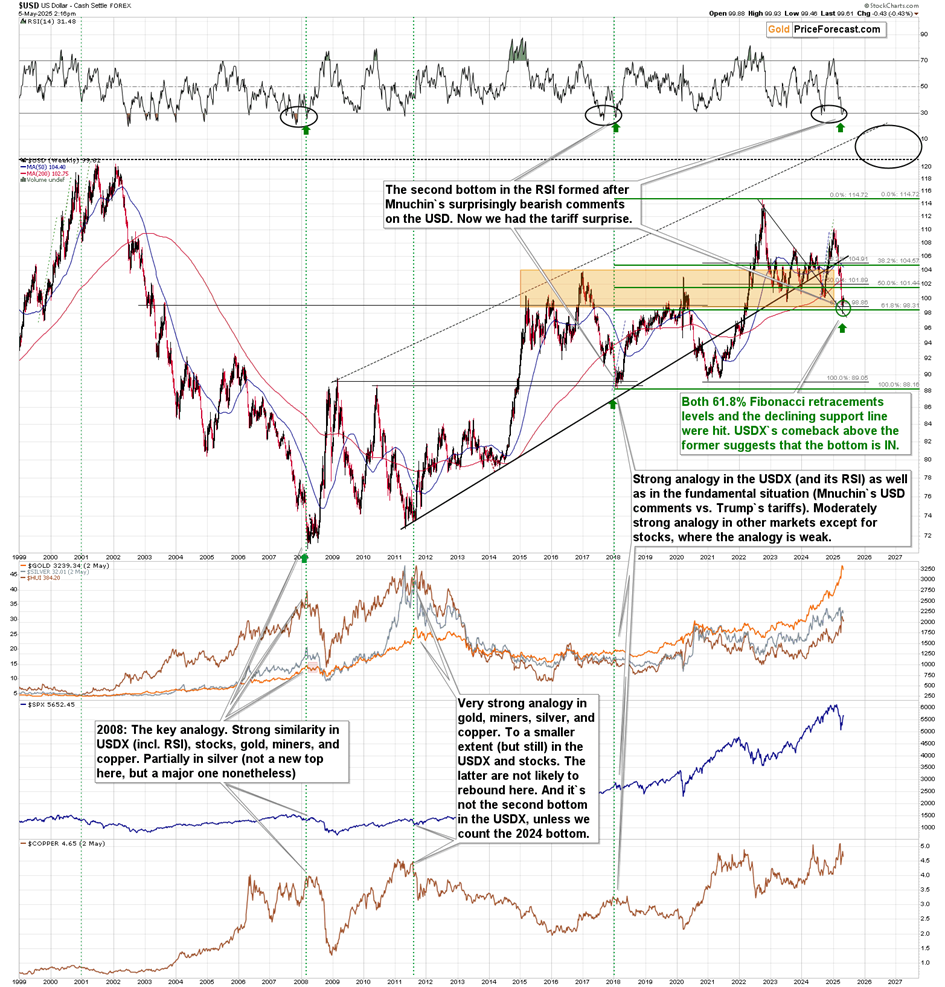
All this also means that since the move lower in the USD Index was just a correction, the opposite is likely the case for the precious metals sector.
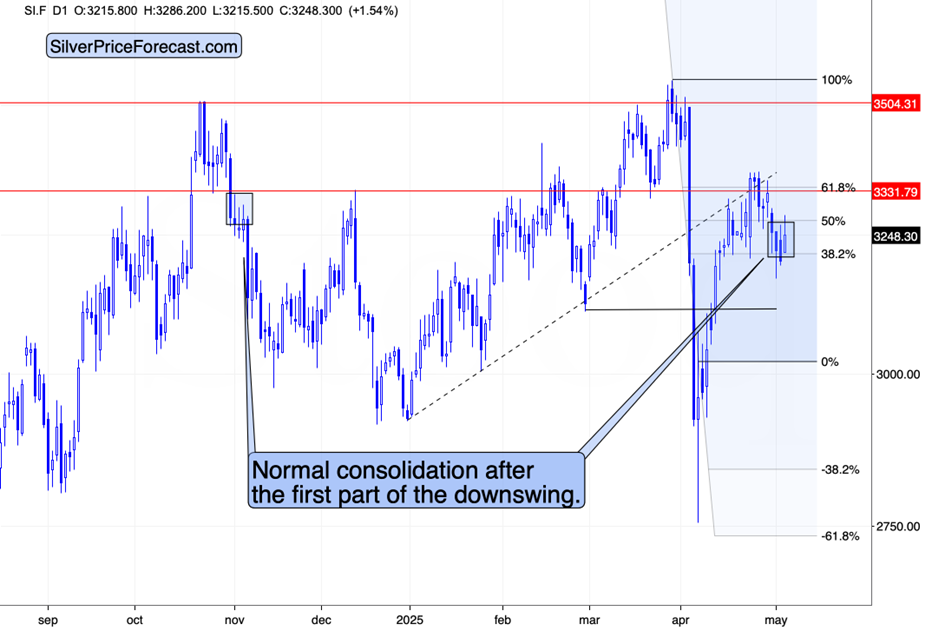
Besides, silver’s back-and-forth movement after a more visible decline is in perfect tune with how it used to behave in a similar set-up. I marked both situations with blue rectangles. Just like it is the case with gold, silver IRA investors have likely barely noticed any change here.
Silver, stocks, and copper have been moving in broad alignment, but when it comes to bigger price moves their moves are quite closely connected. The turnaround in stocks and the rally in the USD Index is likely to translate into lower copper prices.
Stocks teeter near key reversal point
For now, the decline in stocks is just small, but the markets just opened in the U.S.
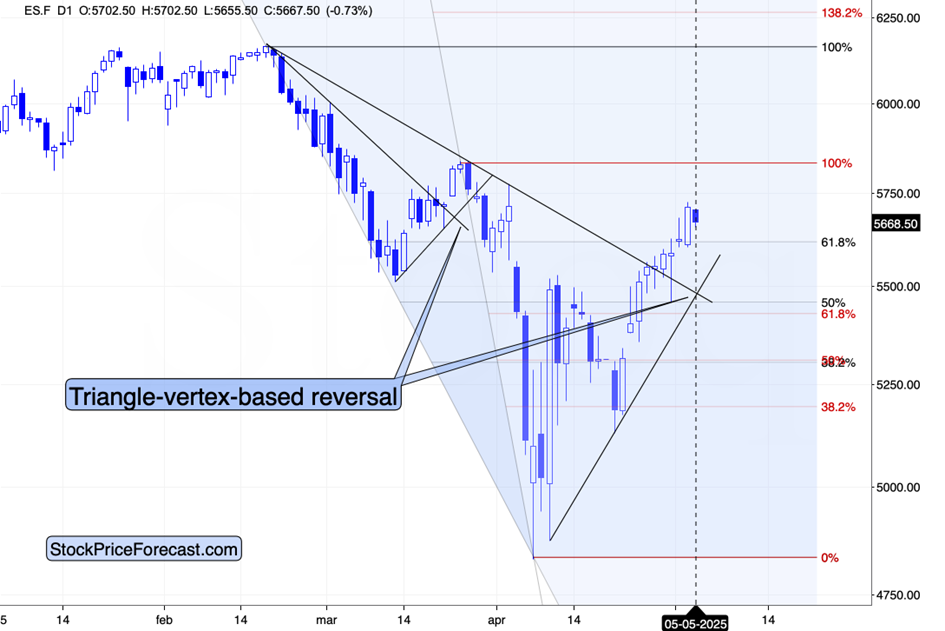
In the analogous situation in mid March, the top formed slightly after the triangle-vertex-based reversal as the lines crossed more or less between sessions. It could be the case that the top is already in, or we could see it tomorrow or on Wednesday.
It seems that the corrective upswing in stocks (that we already profited on) is over or about to be over.
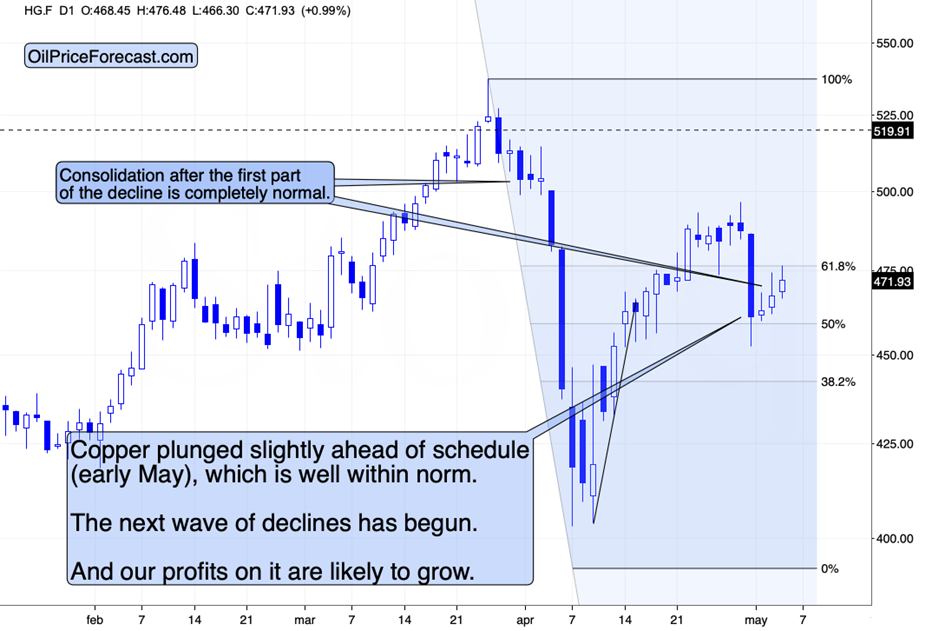
Copper is up a bit today, but overall, this back-and-forth correction seems similar to what we saw in late March and early April after the first part of the decline. The next big move is still likely to be to the downside (and some copper stocks are likely to be affected once again).
The main reason for this is visible on copper’s long-term chart, though.
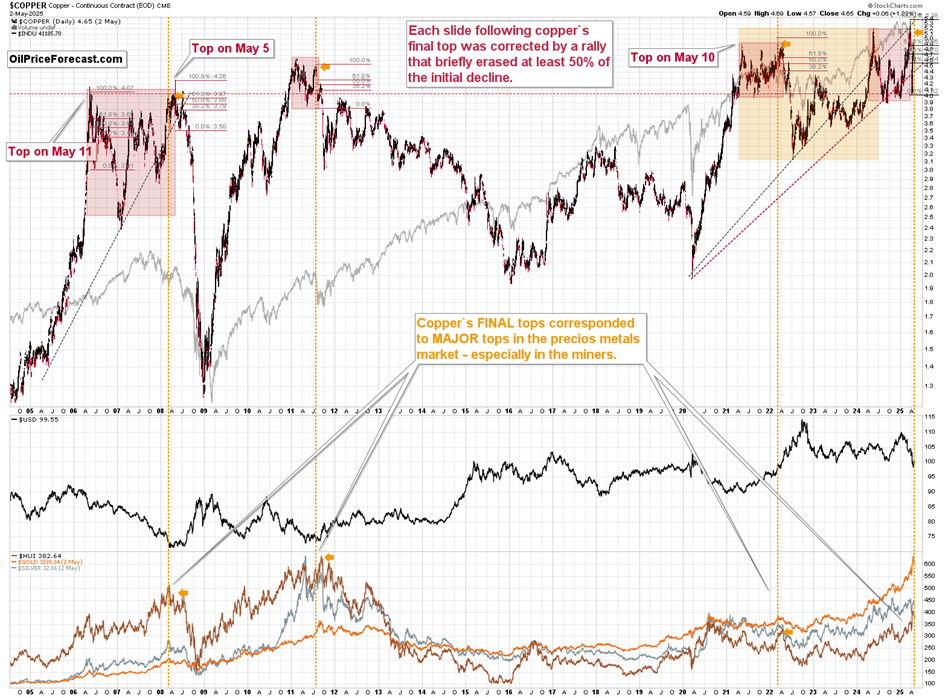
Everything that I wrote about the above chart recently remains up-to-date: Those, who don’t know about this tendency might believe copper’s rebound or even FCX’s (or other copper stocks’ strength) here. But you know that it’s all fake. It’s a gimmick. A final shakeout of those making emotional purchase decisions.
In the previous weeks, I wrote a lot about the links between now and 2008. While the history rhymes instead of being repeated to the letter, but sometimes the market does repeat its performance on important anniversaries. And please note that the final top in copper in 2008 was formed on May 5. If this was to be repeated, we’d be looking for the final top to take place on the next trading session on Monday. This would be in perfect tune with stock market’s triangle-vertex-based reversal and with the fact that the USD Index is likely to rally shortly.
In sum, commodities and stocks are likely to fall together as the USD Index launches a rally that will surprise many. Precious metals are likely to decline based on that, too, which creates some great trading opportunities for those willing to go against the crowd.
Want free follow-ups to the above article and details not available to 99%+ investors? Sign up to our free newsletter today!
Want free follow-ups to the above article and details not available to 99%+ investors? Sign up to our free newsletter today!
Author

Przemyslaw Radomski, CFA
Sunshine Profits
Przemyslaw Radomski, CFA (PR) is a precious metals investor and analyst who takes advantage of the emotionality on the markets, and invites you to do the same. His company, Sunshine Profits, publishes analytical software that any


