|

$SLV ishares silver trust larger cycles and elliott wave

Firstly there is data back to when the ETF fund began in 2006 as seen on the weekly chart shown below. The fund made a low in 2008 at 8.45 that has not since been taken out in price. It could have been up until The point of the spike higher in July 2020. You should be able to assume from the October 2008 lows to the April 2011 highs was a larger degree impulse ending from all time Silver lows either way.

Secondly, the decline from the April 2011 highs down to the May 2011 lows was five waves. Price held below the April 2011 highs during the bounce from the May 2011 lows to the August 2011 high.

The analysis continues below the weekly chart.

Chart

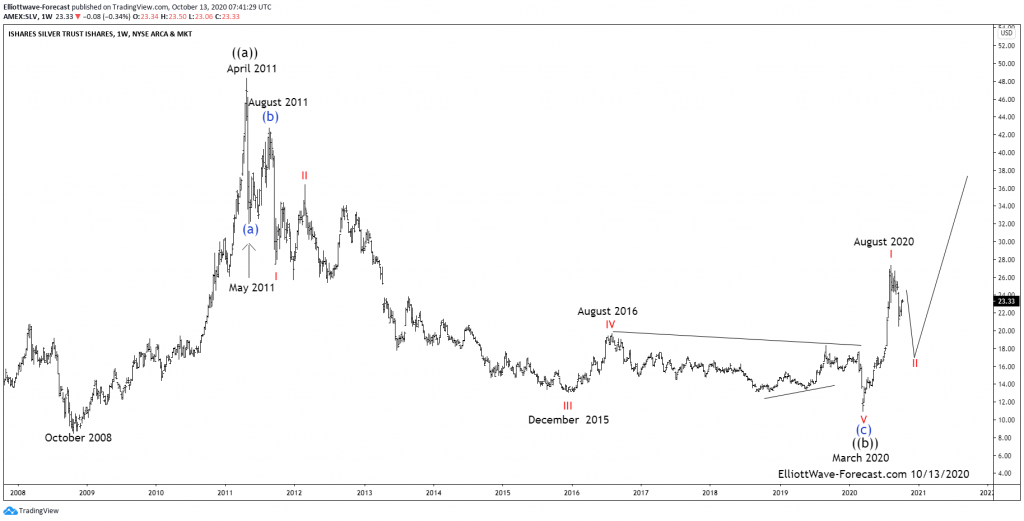
Thirdly, the cycle from the August 2011 high now appears complete. The red I , II & III decline to the December 2015 lows best looks as two Elliott Wave impulses. Next, the bounce to the August 2016 high was strong enough to suggest it had corrected the cycle from the red wave II highs in February 2012. From the August 2016 high the decline appears to be an Elliott Wave triangle structure that ended the wave “E” at the February 2020 highs. From this point in time the instrument printed a clean Elliott wave impulse lower into the March 2020 lows at 10.86.

In conclusion, down from the April 2011 highs SLV exhibits all qualities of an Elliott Wave zig zag  structure that now appears complete at this point. This is partially due to the bounce from the March 2020 lows. It was strong enough and apparently in five waves. This suggests the correction of the cycle up from the all time lows has completed. Near term while below the August 2020 highs silver can correct the cycle up from the March 2020 lows. Afterward a larger degree turn higher is expected again.

Author

Elliott Wave Forecast Team

Elliott Wave Forecast Team

ElliottWave-Forecast.com

More from Elliott Wave Forecast Team
Share:

Editor's Picks

EUR/USD flat lines around 1.1900; looks to US NFP report for fresh directional impetus

The EUR/USD pair is seen oscillating in a narrow trading band around the 1.1900 mark during the Asian session on Wednesday as traders opt to wait for the release of US monthly employment details before placing fresh directional bets.

GBP/USD slips back to daily lows near 1.3640

GBP/USD drops to daily lows near 1.3640 as sellers push harder and the Greenback extends its rebound in the latter part of Tuesday’s session. Looking ahead, the combination of key US releases, including NFP and CPI, alongside important UK data, should keep the pound firmly in focus over the coming days.

Gold recovers to $5,050, focus shifts to US jobs data

Gold turns higher to test $5,050 in the Asian session on Wednesday. Traders assess whether Gold has found a floor following a historic sell-off. The delayed US employment report for January, which was pushed back due to the recently ended four-day government shutdown, will take center stage later on Wednesday.

Ethereum: Whales buy the dip amid rising short bets

Following one of Ethereum's largest weekly drawdowns, whales are slowly returning to action alongside a drop in retail selling pressure. After slightly selling into the decline at the start of the month, whales or wallets with a balance of 10K-100K ETH began buying the dip last Wednesday as prices crashed further. 

Dollar drops and stocks rally: The week of reckoning for US economic data

Following a sizeable move lower in US technology Stocks last week, we have witnessed a meaningful recovery unfold. The USD Index is in a concerning position; the monthly price continues to hold the south channel support.

XRP holds $1.40 amid ETF inflows and stable derivatives market

Ripple trades under pressure, with immediate support at $1.40 holding at the time of writing on Tuesday. A recovery attempt from last week’s sell-off to $1.12 stalled at $1.54 on Friday, leading to limited price action between the current support and the resistance.