Silver buying the dips at the blue box area

In this technical article we’re going to take a quick look at the Elliott Wave charts of Silver (XAG/USD) commodity , published in members area of the website. As our members know, Silver has recently given us correction against the September 6th low. The commodity reached our target zone and completed correction right at the Equal Legs ( Blue Box Area) . In further text we’re going to explain the Elliott Wave pattern and trading setup.
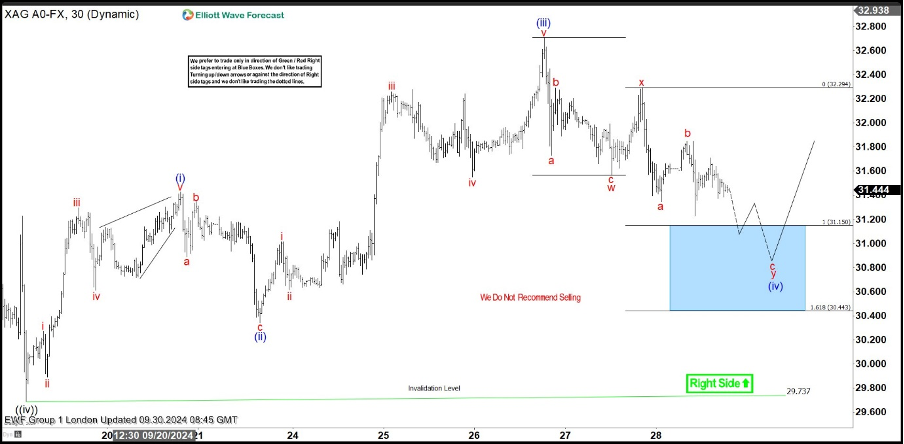
Silver one-hour update 09.30.2024
The commodity is giving us wave (iv) blue correction. The pull back has incomplete structure at the moment. Consequently, we are looking for another short term low toward the extreme zone (blue box). However, we don’t recommend selling it. We expect it to attract buyers at the Blue Box zone. The commodity could make either rally towards new highs or a larger corrective bounce in three waves at least. Once the bounce reaches the 50% Fibonacci retracement level against the connector high – x red, we’ll secure our position by moving the stop-loss to breakeven. Break below the marked invalidation level : 30.44 would invalidate the trade.
A quick reminder:
Our charts are designed for simplicity and ease of trading:
Red bearish stamp + blue box = selling setup
Green bullish stamp + blue box = buying setup
Charts with black stamps are deemed non-tradable.
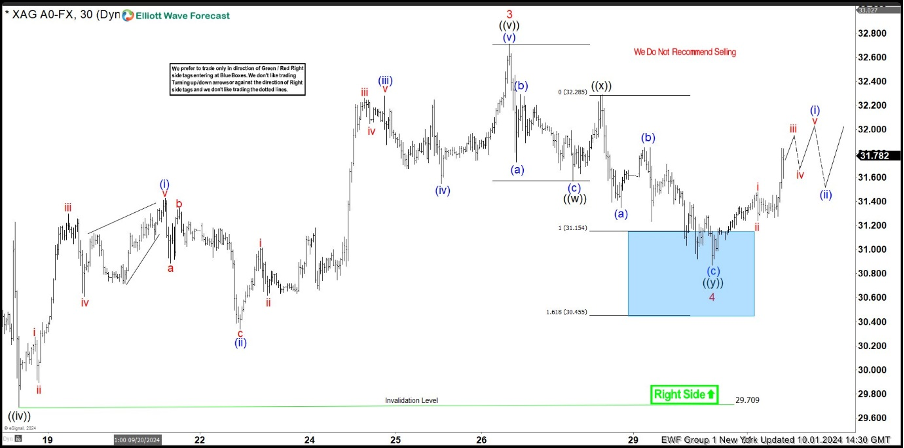
Silver one-hour update 10.01.2024
The commodity made another leg down and found buyers within the Blue Box area as expected. We got a nice rally from our buying zone, consequently counting 4 red pull back completed at 30.86 low. The bounce has exceeded the 50% Fibonacci retracement level against the connector peak – currently marked as ((x)) black. As a result, traders who entered long positions are now enjoying risk-free profits. With the price holding above the 30.86 low, we believe the next leg up can be in progress. For confirmation on the next leg up, we’re looking for a break above the 3 red peak.
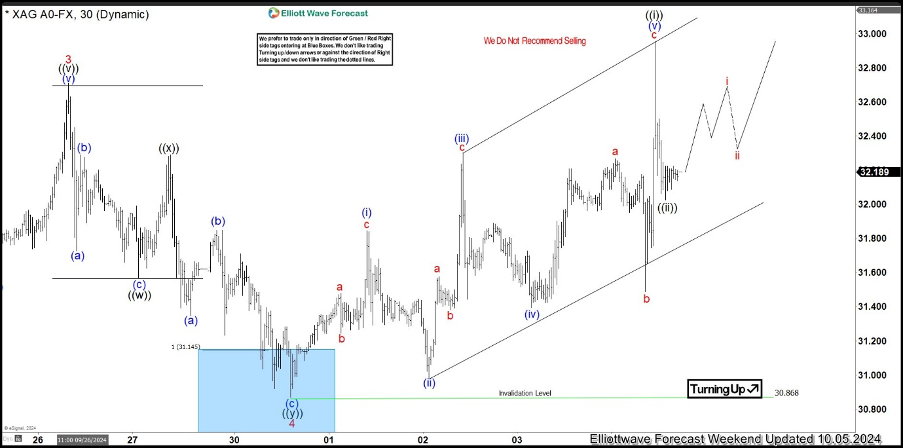
Silver one-hour update 10.05.2024
Eventually the commodity made break of 3 red peak as we expected. We expect Silver to keep trading higher ideally as far as pivot at 30.86 low holds.
To capitalize on these opportunities and stay ahead, consider exploring our expert services and insights. For the latest updates, refer to the most recent charts available in our membership area. We focus on trading instruments with incomplete bullish or bearish swing sequences. The Live Trading Room highlights the best opportunities in real-time.
Author

Elliott Wave Forecast Team
ElliottWave-Forecast.com


