|

Silver (XAG/USD) analysis: Elliott Wave framework suggests $38 downside potential [Video]

Since hitting the record high of $121.64 in January 2026, Silver (XAGUSD) has been in a sustained correction. The decline has developed into a double three Elliott Wave structure, which suggests a long‑term downside target near $38. This level represents the 100% extension of the corrective sequence and remains a key risk if bearish momentum continues.

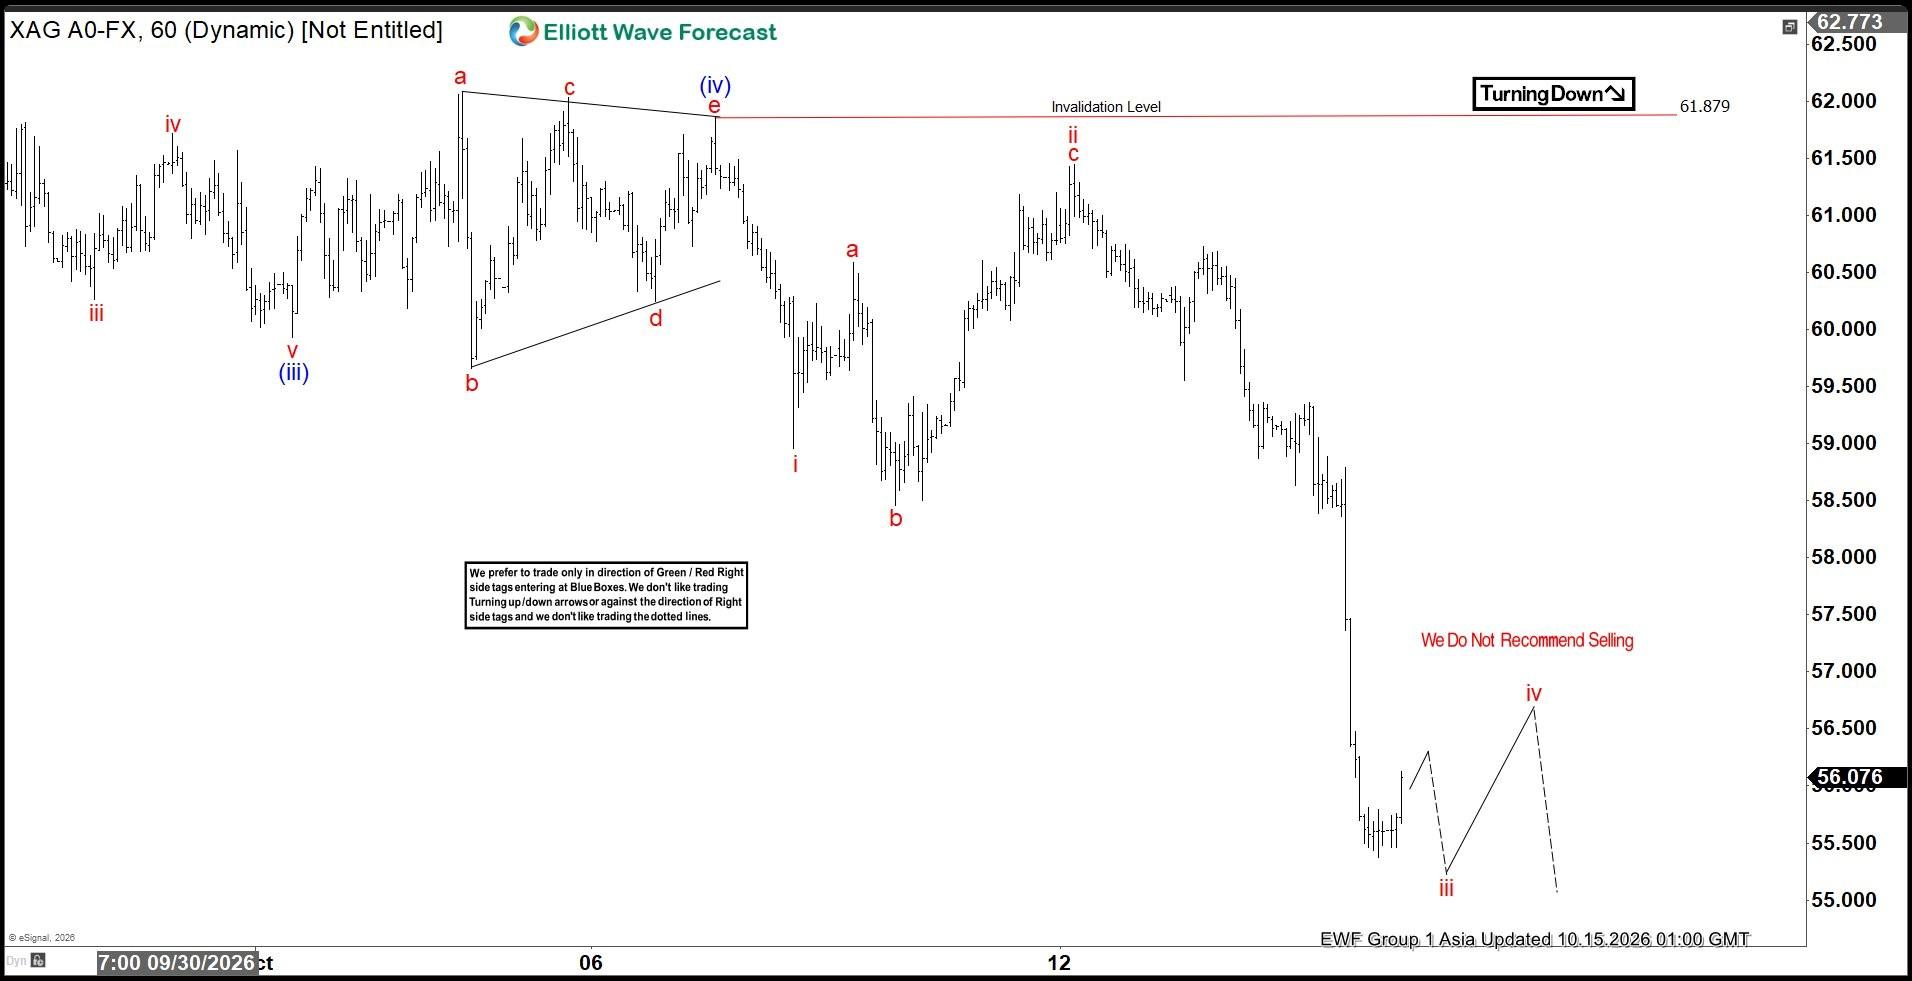
The near‑term cycle from the September 23 high is unfolding as a five‑wave impulse. Wave (i) ended at $63.04, followed by a brief rally in wave (ii) that reached $65.09. The market then dropped in wave (iii) to $59.93, before a pullback in wave (iv) that terminated at $61.80. Price has since resumed lower in wave (v), confirming the continuation of the bearish sequence.

Within wave (v), wave i ended at $58.96, while wave ii retraced to $61.45. The current decline is wave iii, which should complete soon. A corrective bounce in wave (iv) is expected afterward, before another leg lower finalizes wave (v) and completes the cycle from September 23.

As long as the pivot at $61.87 remains intact, rallies should fail in either three or seven swings. This reinforces the downside bias and keeps the $38 target in view. The Elliott Wave framework highlights both the immediate bearish path and the broader risk of deeper losses.

Silver 60 minute Elliott Wave chart
XAGUSD

XAG/USD Elliott Wave [Video]

Youtube preview

Author

Elliott Wave Forecast Team

Elliott Wave Forecast Team

ElliottWave-Forecast.com

More from Elliott Wave Forecast Team
Share:

Editor's Picks

AUD/USD keeps the red near 0.6950 after weak Aussie jobs data

AUD/USD holds losses near 0.6950 on disappointing Australian jobs data, extending the previous day's retracement slide from the monthly high and hitting a fresh weekly low during Thursday’s Asian session. Meanwhile, declining US bond yields drag the US Dollar away from the April 2025 high, touched after Wednesday's hot US CPI, helping limit losses for the currency pair.

USD/JPY slides back below 158.00 as USD reverses post-CPI gains

USD/JPY extends the previous day's pullback from a three-week high, attracting follow-through selling and sliding below 158.00 during Thursday's Asian session. Traders remain on high alert amid speculation that authorities will step in to prop up the Japanese Yen. The US Dollar, meanwhile, reverses Wednesday's hot CPI-led gains to April 2025 highs as US bond yields retreat on China bond-buying talk, further pressuring the pair.

Gold rebounds firmly as China Treasuries-buying report smashes US yields

Gold stages a solid comeback from weekly lows, retakes $4,150 early Thursday. US Dollar declines sharply alongside Treasury yields on China’s bond-buying report. Technically, the daily RSI remains bearish and a headwind for Gold buyers.

Zcash declines as US inflation surprise offsets fresh ETF inflows
Zcash (ZEC) is trading in the red on Friday, extending its previous day’s roughly 6% losses as the broader cryptocurrency market falls on rising US inflation. The US Consumer Price Index (CPI) print came in higher than expected, at an annual increase of 3.7% versus the expected 3.6%, raising concerns about inflation and rate hikes.
China seems routing US Treasury holdings through Canada

According to a Bloomberg report, China seems to be moving United States securities to non-US custodian banks in other countries, masking its role in financing US deficits.

Has Bitcoin really escaped the macro forces it was built to fight?
Over 17 years ago, Satoshi Nakamoto designed Bitcoin (BTC) on the back of a global financial crisis as an alternative to the global monetary system outside the control of central banks, governments and traditional intermediaries. This raises a key question: has Bitcoin really become independent of the macroeconomic forces it was built to challenge?