Zcash Price Forecast: ZEC declines as US inflation surprise offsets fresh ETF inflows
- Zcash extends losses on Thursday after declining nearly 6% the previous day.
- Hotter-than-expected US CPI data print of 3.7% annual increase in headline inflation raises inflation and rate hike concerns.
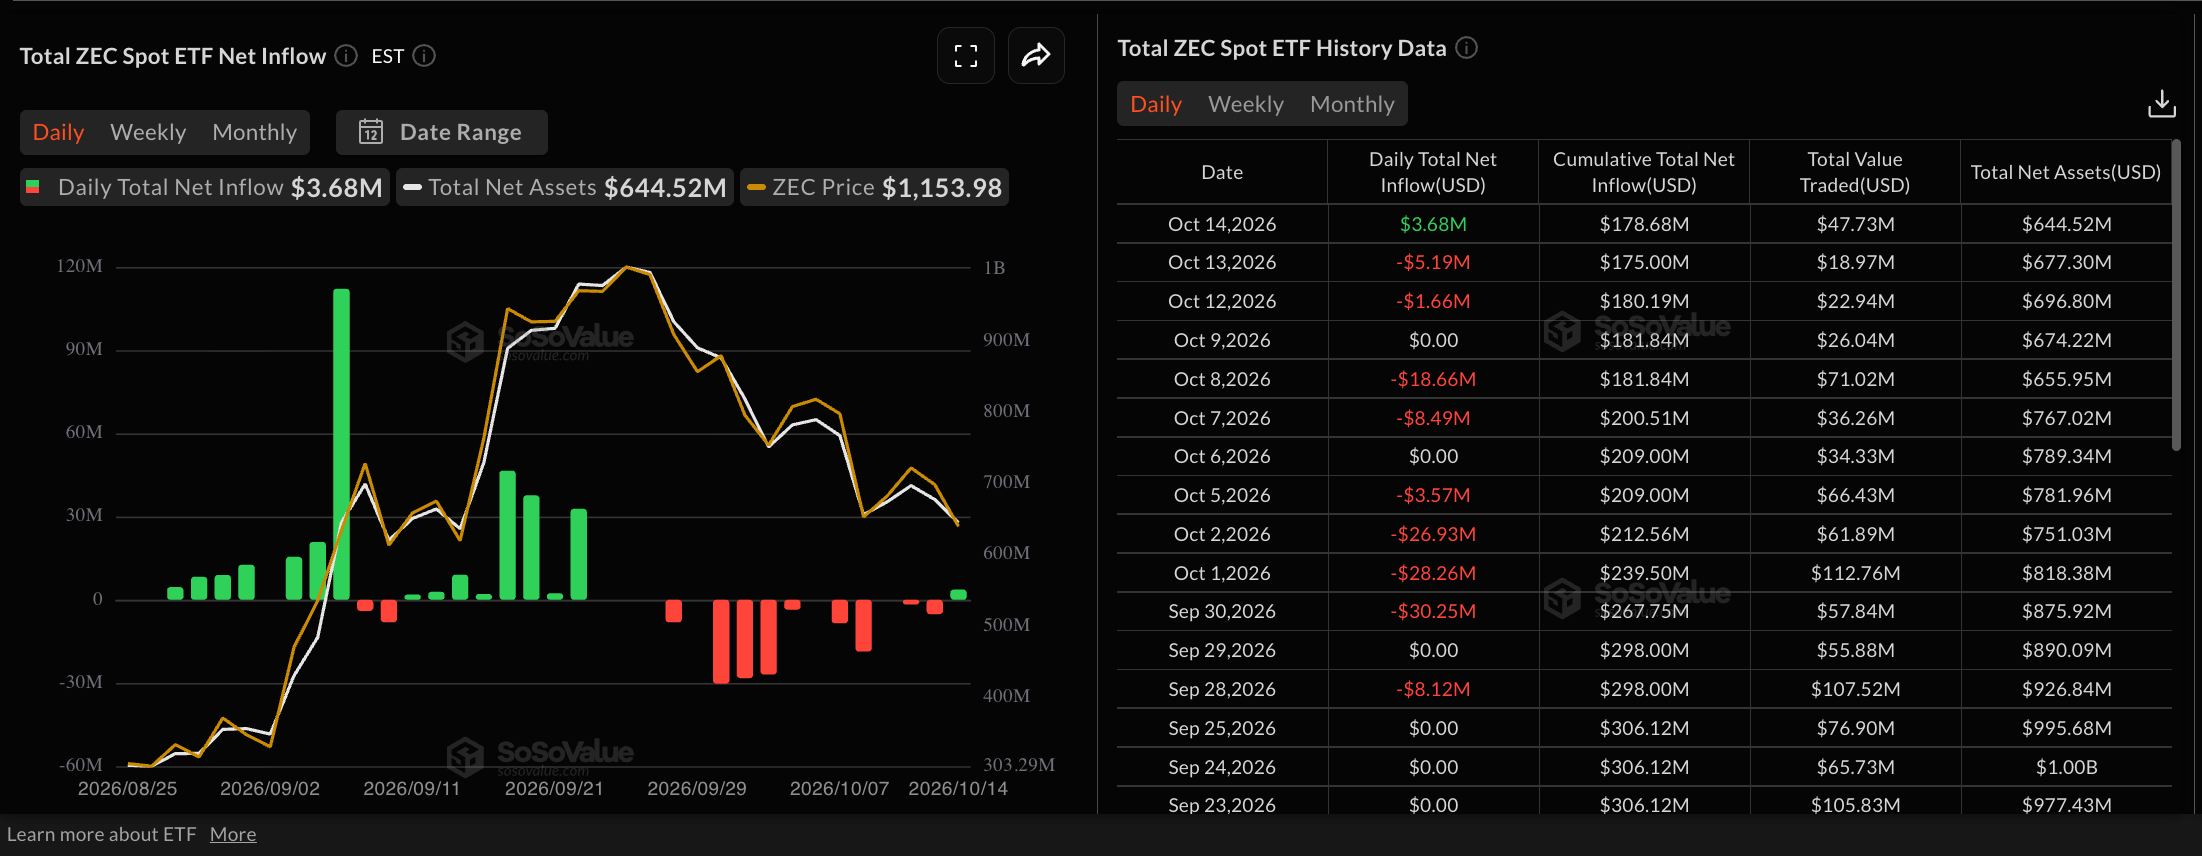
- Grayscale’s Zcash ETF recorded over $3 million in inflows on Wednesday, marking a positive turnaround after two consecutive weeks of outflows.

Zcash (ZEC) is trading in the red on Friday, extending its previous day’s roughly 6% losses as the broader cryptocurrency market falls on rising US inflation. The US Consumer Price Index (CPI) print came in higher than expected, at an annual increase of 3.7% versus the expected 3.6%, raising concerns about inflation and rate hikes. The macroeconomic concerns offset the renewed positive inflows in Grayscale’s ZEC-focused Exchange Traded Fund (ETF), with over $3 million in inflows on Wednesday.
Zcash risks a four-hour close below last week’s low of $1,115, which could extend the decline toward the $1,000 psychological support level.
Macro pressure offsets institutional demand
The US inflation surprise with the annual CPI print at 3.7%, above forecasts of 3.6%, fuels a near-term sell-off in the broader crypto market. The Crypto King, Bitcoin (BTC), faces a downside risk below $80,000, as previously reported by FXStreet, which could further boost selling pressure across altcoins.
On the other hand, Grayscale’s Zcash ETF (ZCSH) recorded $3.68 million in inflows after two consecutive days of outflows, which followed two consecutive weekly outflows, signaling a mild improvement in institutional confidence. The signs of renewed buying pressure in the ZCSH ETF fail to offset the macroeconomic headwinds, extending the privacy coin’s pullback in the spot market.
Technical outlook: Could Zcash price fall below $1,000?
Zcash trades around $1,111 at press time on Thursday, extending a corrective phase after forming the $1,698 peak in late September. The privacy coin sits well beneath the 50-period Exponential Moving Average (EMA) on the four-hour chart at $1,242 and the 200-period EMA at $1,264, keeping the pair firmly capped in the near term.
Momentum reinforces this negative tone, with the Moving Average Convergence Divergence (MACD) and its signal line extending below zero and showing deeply negative histogram bars, while the Relative Strength Index (RSI) hovers just above oversold territory at 34, hinting that sellers remain in control.
From a technical perspective, Zcash is testing the bearish breakout below last week's low at $1,115 on the four-hour chart. A sustained close could extend the decline toward the September 4 high of $1,050, with the $1,000 psychological threshold providing strong support. Any deeper pullbacks show an extended 15% downside risk, potentially targeting the August 23 high at $888.
On the topside, initial resistance is located at the 50-period EMA around $1,242, followed by the 200-period EMA at $1,264, which together define a dense supply zone that Zcash would need to reclaim to ease downside pressure.
(The technical analysis of this story was written with the help of an AI tool. Know more.)
Author

Vishal Dixit
FXStreet
Vishal Dixit holds a B.Sc. in Chemistry from Wilson College but found his true calling in the world of crypto.



