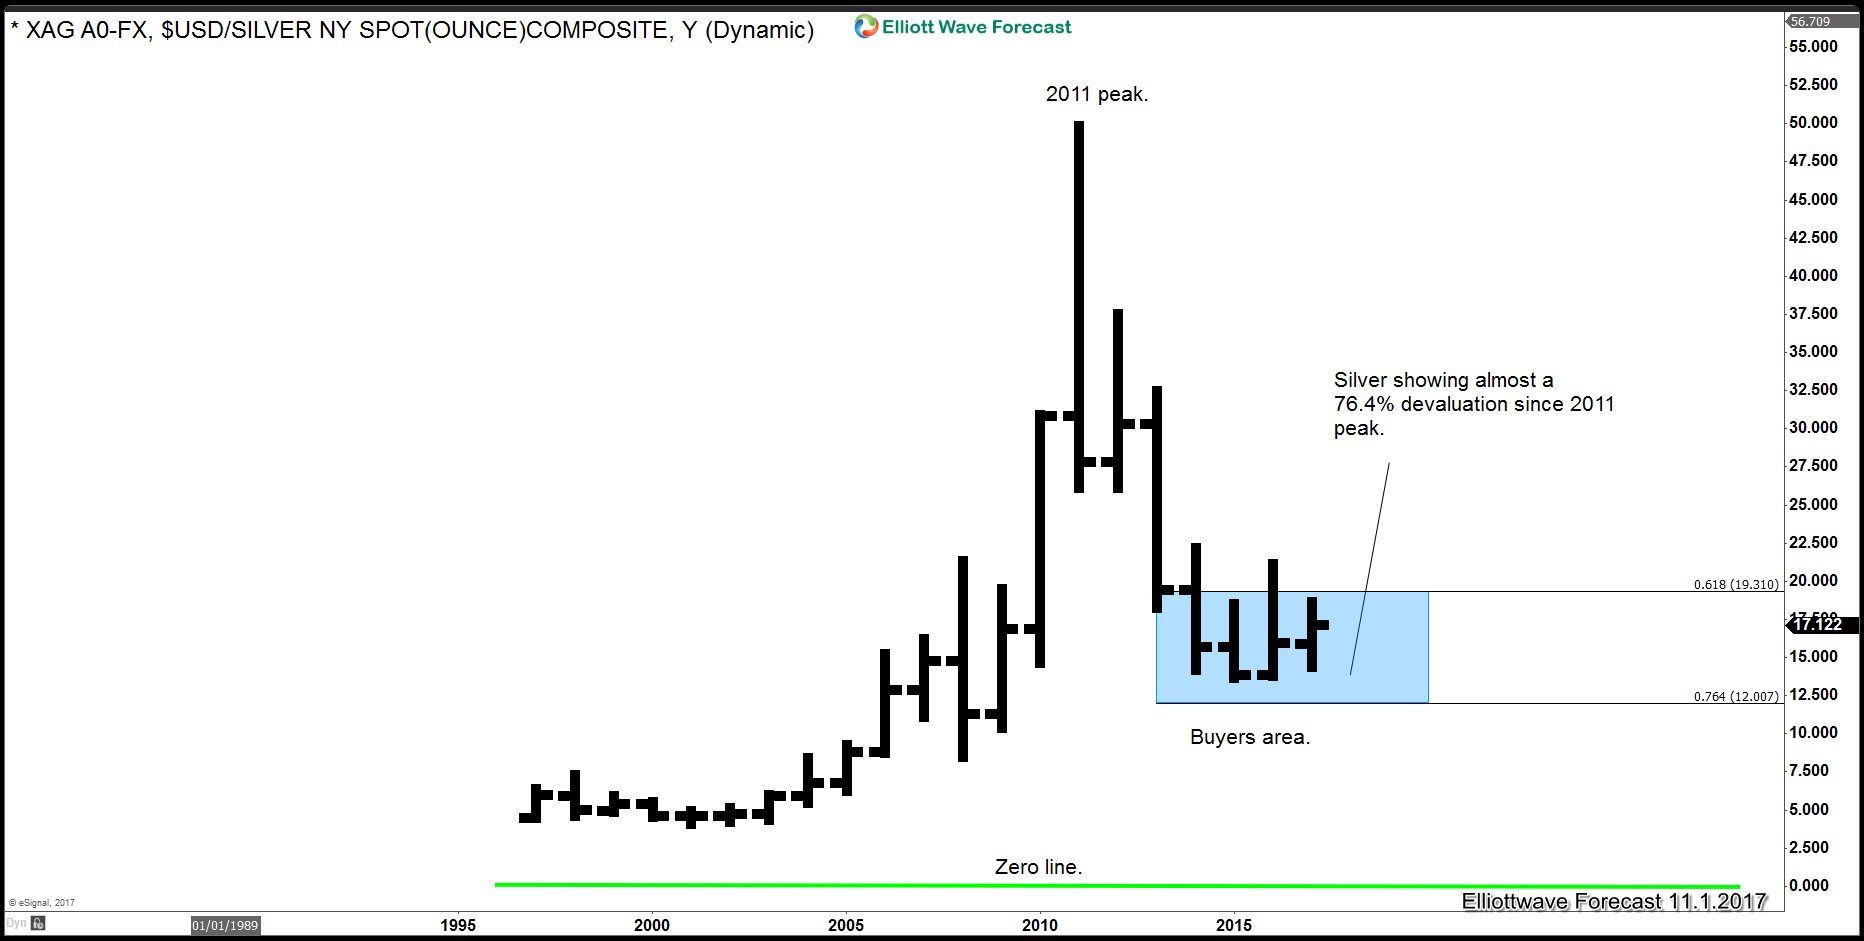
Commodities have been in an All-time correction since they peaked in 2011 and they can be showing the next good Long-term Trading or an Investing opportunity across the Market. Commodities like Silver and Gold have always represented value and we cannot expect that value to disappear all of a sudden. Silver is a very interesting instrument because together with Oil, they have shown the biggest devaluation against the US Dollar and consequently will represent the biggest opportunity. The Following chart represent the all time cycle in Silver and also the stage within the correction which is showing the extreme area and off course the Invalidation level in the Yearly cycle. As we can see the Instrument has dropped back almost to the 76.4% of the all time rally and has entered a buying area.

Chart

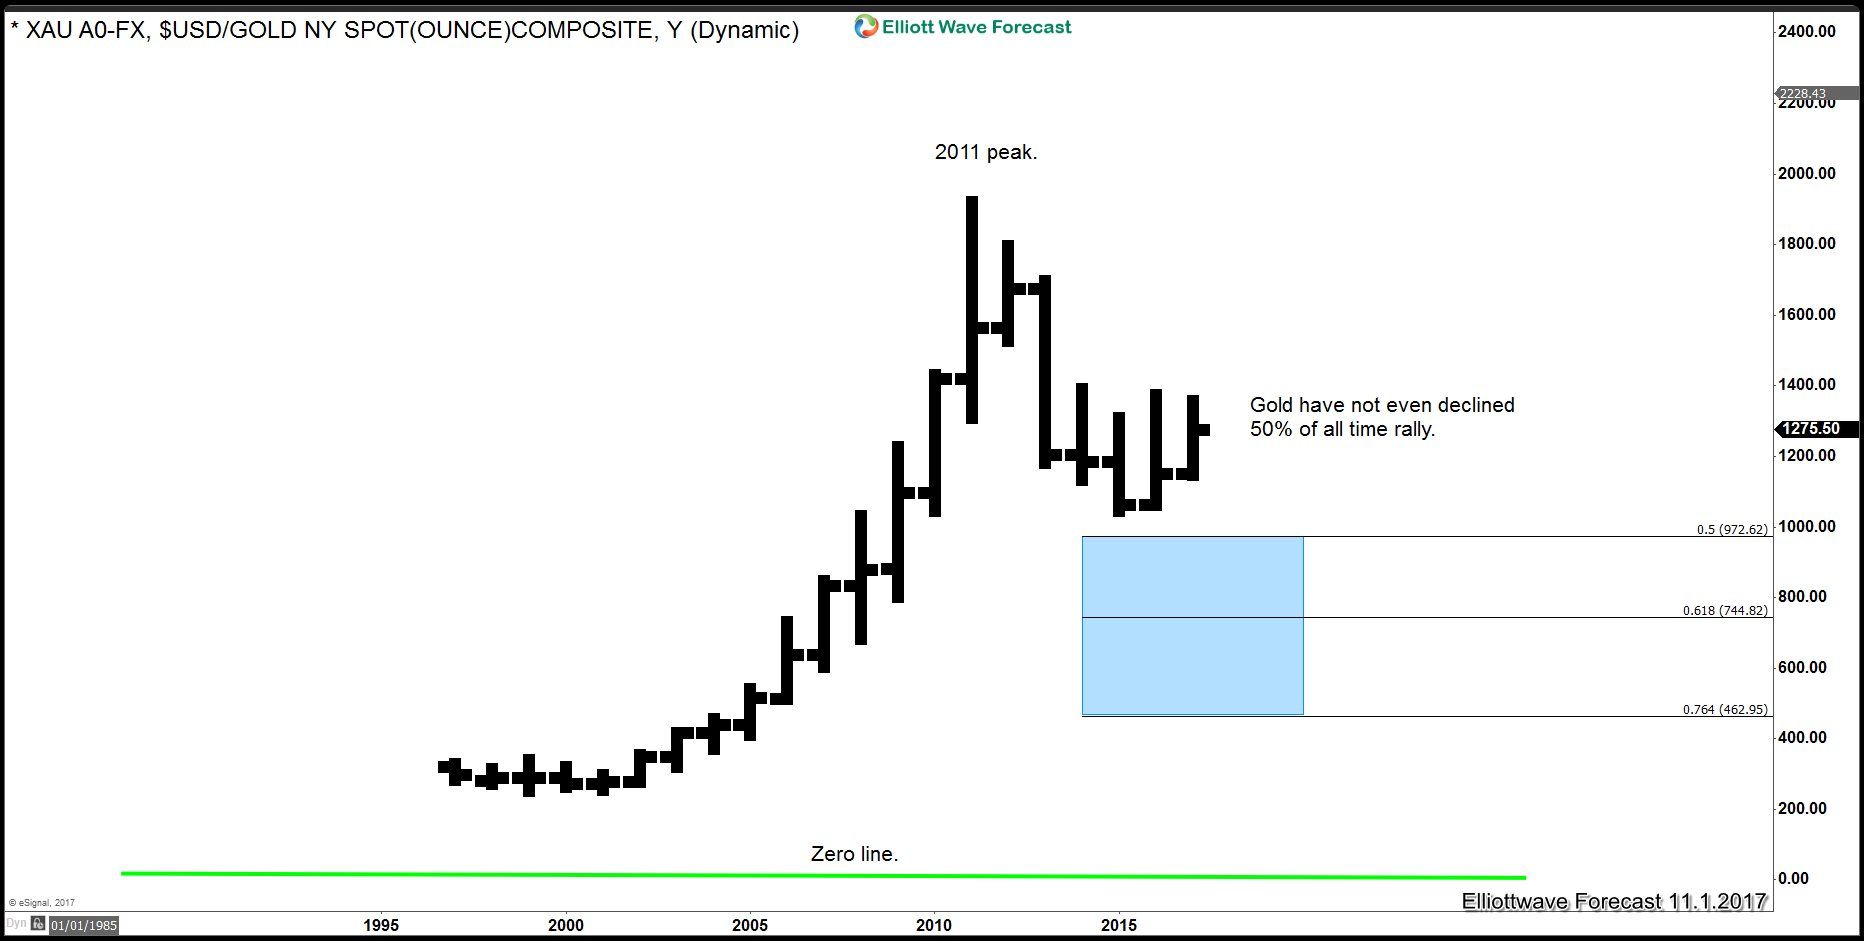
The whole group has declined since the peak in 2011 but what makes Silver the best opportunity is the degree and how deep the decline has been, chart below shows Gold chart from all time lows, we can see the decline in Gold has not been so deep, making Silver a better long term investment opportunity.

Chart

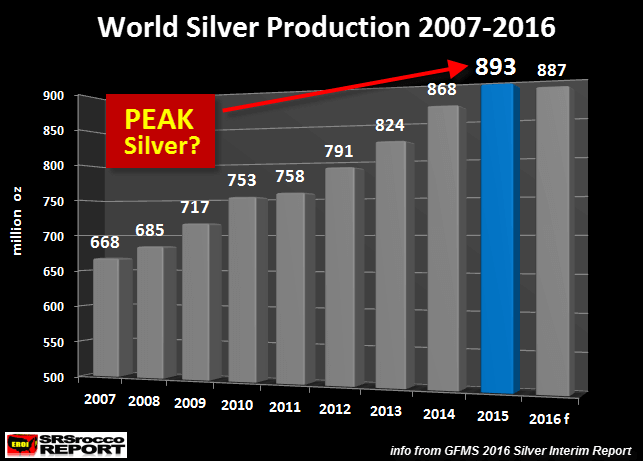
There are many Fundamental reasons to justify the decline but the production numbers is the simplest way to understand a deep decline. The higher the production of Silver, there will be higher stockpiles in the Market and consequently the price will drop. According to the Silver Institute the Silver Production slowed down in 2016 and consequently the Instrument is creating a base in price.

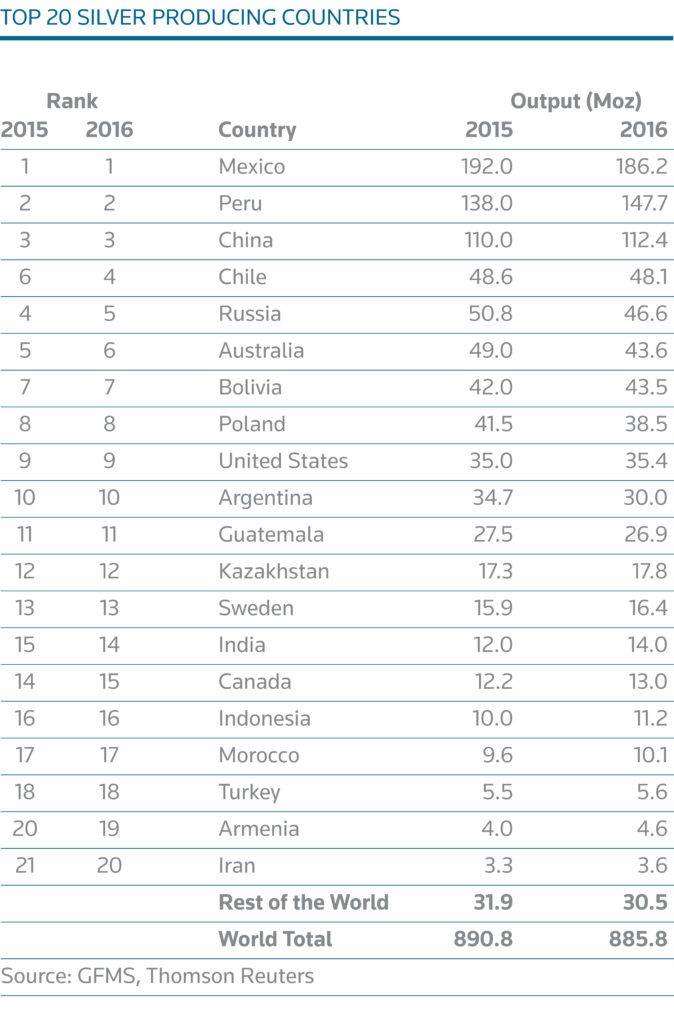
The following charts show the break down in production and the breakdown by county

Chart


Chart

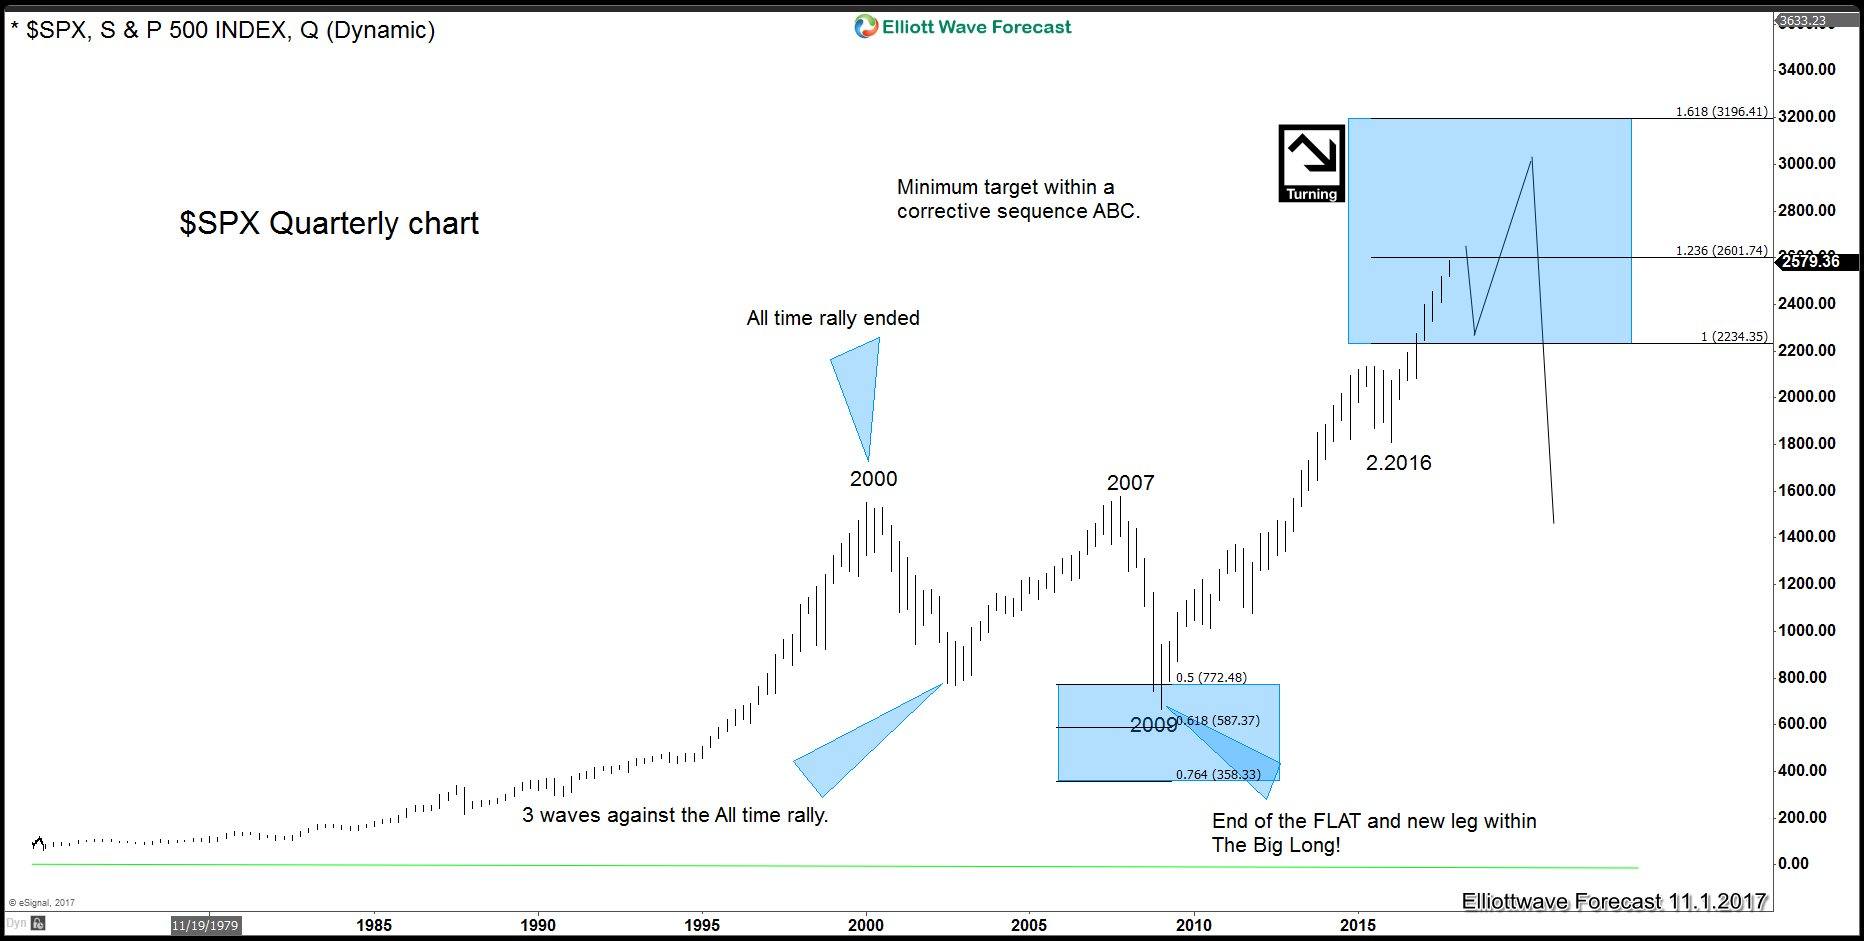
The $SPX Index has reached the Blue Box which highlights an extreme area from the all time low, but many other World Indices have still not reached the same degree area. The idea is that $SPX is at levels at which Silver was in 2011 extreme and while it stays below 3196, a multi-year correction could unfold. Above 3196 would suggest the next big pull back would only correct the cycle from 2009 low before another leg higher. Even then a multi-year correction should be seen before the next leg higher in the Index.

Chart

Silver will be sideways and even when it can make a new marginal low in the Weekly chart, it has already reached the target within the pull back. The reason why the Instrument can be sideways is due to the fact that most of the World Indices have not yet ended the all time cycles and they seem to have more upside. We believe in the idea that when the World Indices end the cycle from all time lows, they will enter in a multi year correction similar to the one that happened from 2000 through 2009 and that will be the moment when Silver and all commodities will enter a multi year cycle higher which will have scope to drive Silver prices above the $60.00 level. Buying the Instrument this low represents a great long term opportunities not only to buy commodities, but also a chance to pick the top in World Indices. The following chart represents the overlay of Silver and $SPX and we can see what happened between the year 2000-2009 and how since the peak in 2011 $SPX has been trading higher and Silver lower.

Chart

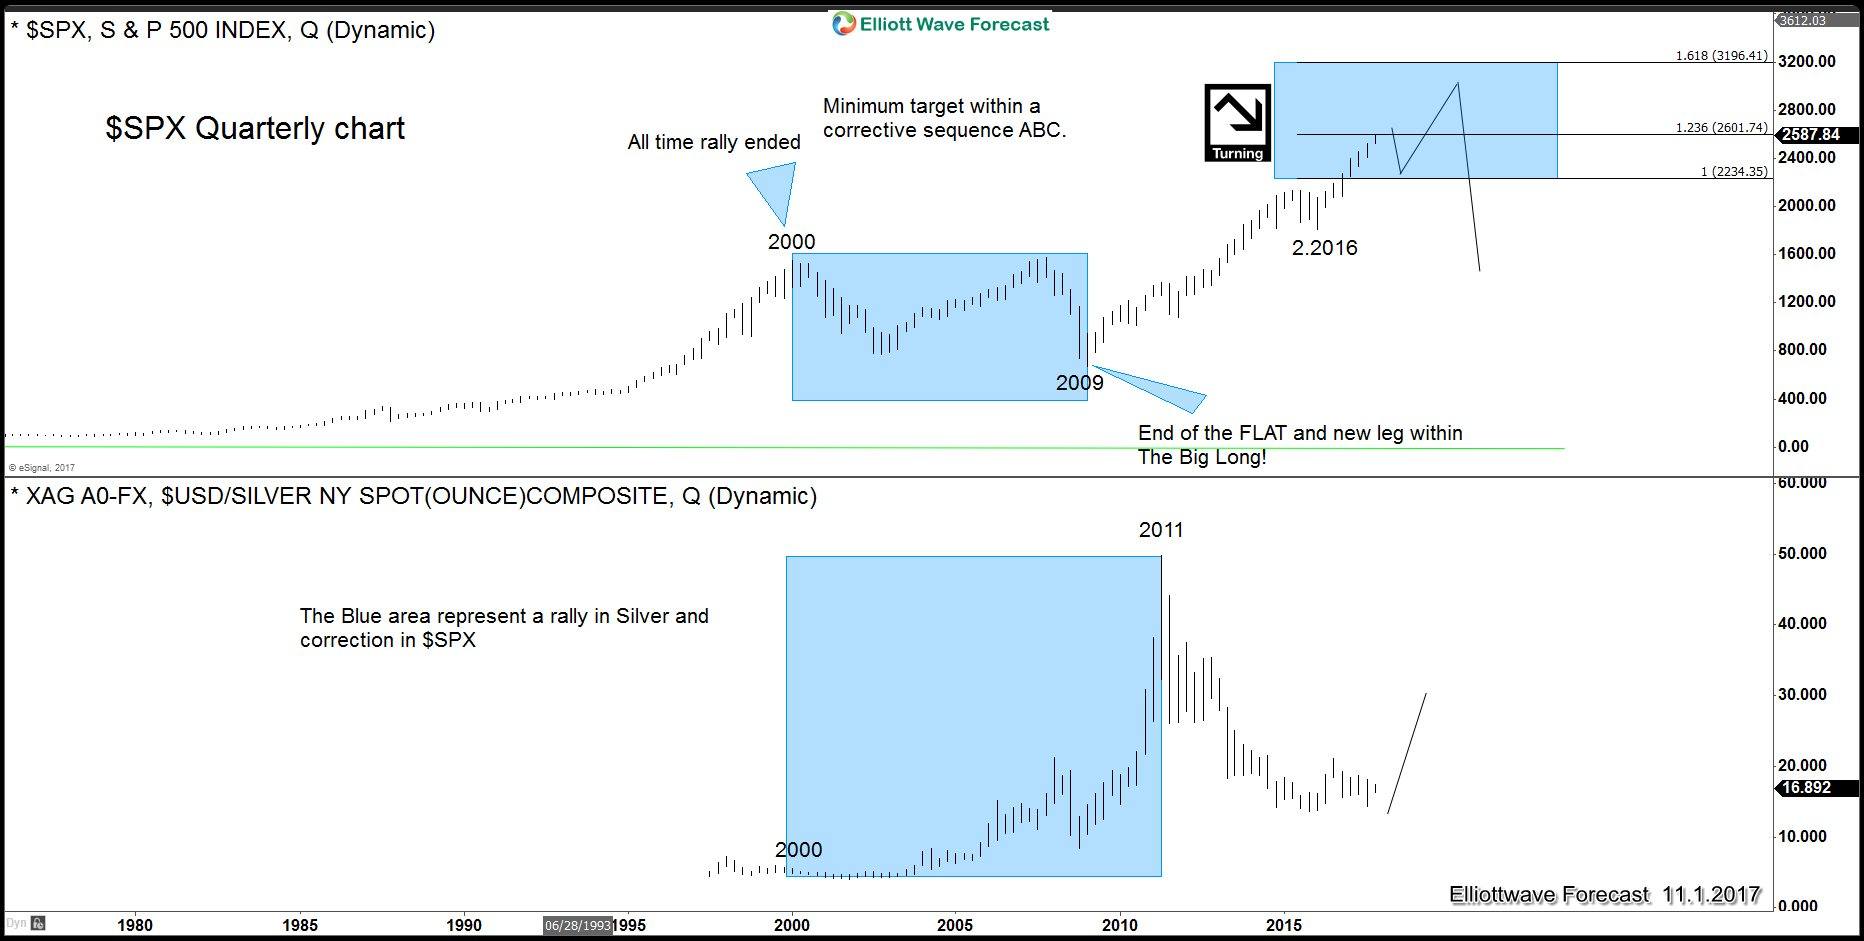
Sometimes trades need to understand the Market acts as a whole and this previous chart shows a smart way to pick the top in World Indices instead of trying to sell any new high. Our advice is to trade smart and understand the concept of one Market and be able to catch the Big Short in Indices without actually selling the Indices.


Become a Successful Trader and Master Elliott Wave like a Pro. Start your Free 14 Day Trial at - Elliott Wave Forecast.

FURTHER DISCLOSURES AND DISCLAIMER CONCERNING RISK, RESPONSIBILITY AND LIABILITY Trading in the Foreign Exchange market is a challenging opportunity where above average returns are available for educated and experienced investors who are willing to take above average risk. However, before deciding to participate in Foreign Exchange (FX) trading, you should carefully consider your investment objectives, level of xperience and risk appetite. Do not invest or trade capital you cannot afford to lose. EME PROCESSING AND CONSULTING, LLC, THEIR REPRESENTATIVES, AND ANYONE WORKING FOR OR WITHIN WWW.ELLIOTTWAVE- FORECAST.COM is not responsible for any loss from any form of distributed advice, signal, analysis, or content. Again, we fully DISCLOSE to the Subscriber base that the Service as a whole, the individual Parties, Representatives, or owners shall not be liable to any and all Subscribers for any losses or damages as a result of any action taken by the Subscriber from any trade idea or signal posted on the website(s) distributed through any form of social-media, email, the website, and/or any other electronic, written, verbal, or future form of communication . All analysis, trading signals, trading recommendations, all charts, communicated interpretations of the wave counts, and all content from any media form produced by www.Elliottwave-forecast.com and/or the Representatives are solely the opinions and best efforts of the respective author(s). In general Forex instruments are highly leveraged, and traders can lose some or all of their initial margin funds. All content provided by www.Elliottwave-forecast.com is expressed in good faith and is intended to help Subscribers succeed in the marketplace, but it is never guaranteed. There is no “holy grail” to trading or forecasting the market and we are wrong sometimes like everyone else. Please understand and accept the risk involved when making any trading and/or investment decision. UNDERSTAND that all the content we provide is protected through copyright of EME PROCESSING AND CONSULTING, LLC. It is illegal to disseminate in any form of communication any part or all of our proprietary information without specific authorization. UNDERSTAND that you also agree to not allow persons that are not PAID SUBSCRIBERS to view any of the content not released publicly. IF YOU ARE FOUND TO BE IN VIOLATION OF THESE RESTRICTIONS you or your firm (as the Subscriber) will be charged fully with no discount for one year subscription to our Premium Plus Plan at $1,799.88 for EACH person or firm who received any of our content illegally through the respected intermediary’s (Subscriber in violation of terms) channel(s) of communication.

Recommended Content


Recommended Content

Editors’ Picks

EUR/USD extends gains above 1.0700, focus on key US data

EUR/USD extends gains above 1.0700, focus on key US data

EUR/USD meets fresh demand and rises toward  1.0750 in the European session on Thursday. Renewed US Dollar weakness offsets the risk-off market environment, supporting the pair ahead of the key US GDP and PCE inflation data. 

EUR/USD News

USD/JPY keeps pushing higher, eyes 156.00 ahead of US GDP data

USD/JPY keeps pushing higher, eyes 156.00 ahead of US GDP data

USD/JPY keeps breaking into its highest chart territory since June of 1990 early Thursday, recapturing 155.50 for the first time in 34 years as the Japanese Yen remains vulnerable, despite looming intervention risks. The focus shifts to Thursday's US GDP report and the BoJ decision on Friday. 

USD/JPY News

Gold closes below key $2,318 support, US GDP holds the key

Gold closes below key $2,318 support, US GDP holds the key

Gold price is breathing a sigh of relief early Thursday after testing offers near $2,315 once again. Broad risk-aversion seems to be helping Gold find a floor, as traders refrain from placing any fresh directional bets on the bright metal ahead of the preliminary reading of the US first-quarter GDP due later on Thursday.

Gold News

Injective price weakness persists despite over 5.9 million INJ tokens burned

Injective price weakness persists despite over 5.9 million INJ tokens burned

Injective price is trading with a bearish bias, stuck in the lower section of the market range. The bearish outlook abounds despite the network's deflationary efforts to pump the price. 

Read more

Meta takes a guidance slide amidst the battle between yields and earnings

Meta takes a guidance slide amidst the battle between yields and earnings

Meta's disappointing outlook cast doubt on whether the market's enthusiasm for artificial intelligence. Investors now brace for significant macroeconomic challenges ahead, particularly with the release of first-quarter GDP data.

Read more

Majors

Cryptocurrencies

Signatures