Silver price: Monthly volatility fracture resets the map into February

The post-spike unwind shifts silver into two-way discovery, with 88.45 as the upper gate and 68.91 as first support.
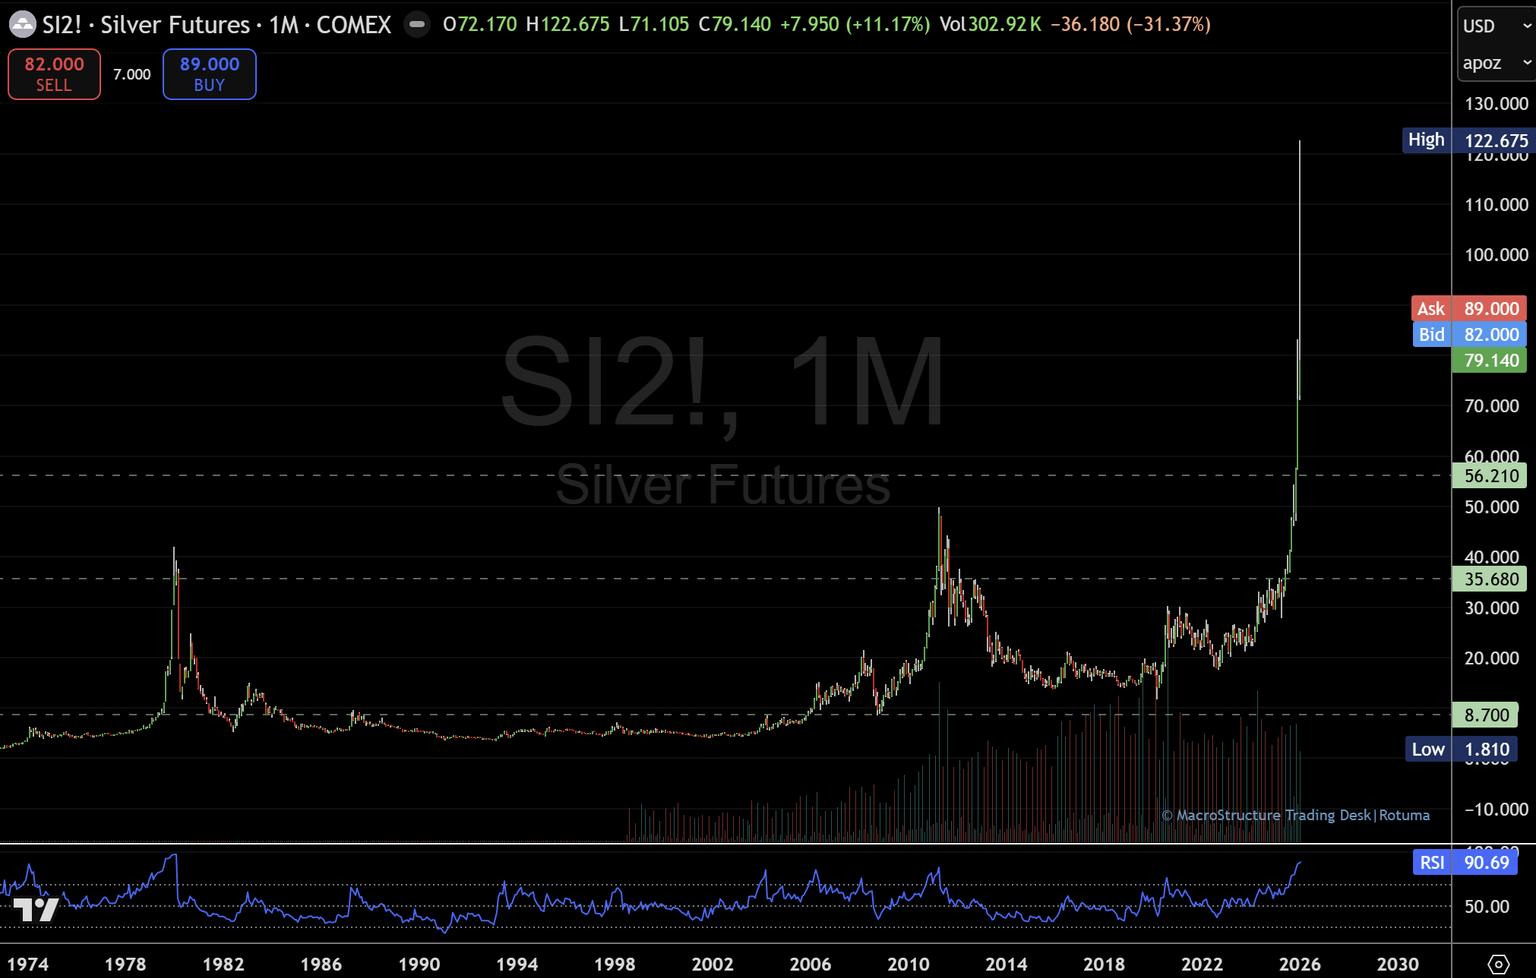
Silver futures desk update — February 1, 2026
Volatility fracture on the monthly chart resets the map into February
Silver just printed the kind of month that forces a reset.
After an explosive run that pushed price into a near-vertical phase, the unwind arrived with the same intensity. When a market expands that fast, it often doesn’t “cool off gently” — it snaps back, breaks prior rhythm, and leaves behind a fresh set of references that matter more than any narrative.
Silver took the hardest hit in the latest market meltdown, sliding more than 36% at the close of January trades after a steep multi-Month surge, with January recording the most volatile month of more than 3 decades. The speed of that reversal is the bigger story than the percentage itself: fast moves tend to invite forced flow, and once liquidation starts, the tape can travel farther than most expect — in both directions.
A volatility fracture usually creates a two-way environment
This sequence — vertical expansion followed by a violent retracement — has now left a visible fracture on the monthly chart. In plain terms, the market stops behaving like a clean trend and starts behaving like two-way discovery.
Moves of this size usually have less to do with headlines and more to do with positioning, leverage, and forced flow. When price goes vertical, it often comes back just as hard, and the next phase becomes less about predicting direction and more about tracking acceptance vs. rejection at key gates.
With February about to begin, my focus is on how silver responds to the decision points created by this volatility event. For the next phase, I’m treating silver as a decision-box market. The edges matter more than the middle.
The decision gates on my desk for February
- Upper decision gate: 88.45
- Lower decision gate: 68.91
Between these two levels, I assume the base case is rotation and two-way trade until the market proves otherwise. After a fracture, the middle of the range can be noisy, with sharp swings that punish impatience.
Upside path: Reclaim and hold above 88.45
If silver can reclaim 88.45 and hold above it, the upper ladder comes back into play. In that scenario, the next references on my map are:
- 95.77
- 100.91
- 106.05
- 112.40
A quick push above the gate is not the same as acceptance. What matters is whether price can build time above 88.45 without snapping back into the box as February unfolds.
Downside path: Failure below 68.91 shifts focus lower
On the downside, 68.91 is the first support line. If this level holds, it keeps the upper ladder alive and supports the idea that the market is stabilising into a two-way structure.
If 68.91 fails, the focus shifts to the next downside pockets:
- 56.21
- then 35.68 as the deeper structural magnet
That 35.68 zone matters because it sits closer to the prior base reference on the long-term map — the type of level markets often revisit when a vertical phase fully unwinds into a longer digestion cycle.
Desk note into the February open
After a volatility fracture, the biggest risk is getting chopped in the middle. I’d rather let price come to the gates and respond to what it does there than guess inside the noise.
For now, the read is simple:
- Above 88.45: does price accept and build, or reject and snap back?
- At 68.91: does support absorb and rotate, or fail and open the next pocket?
Is 68.91 holding — or failing?
These desk updates document a structure-first process, observing how price accepts or rejects predefined levels over time. Coverage spans futures, commodities, forex, bonds, crypto, stocks, and indices, with structure providing context before direction. This observation is for informational purposes only and does not constitute financial advice.
Structure defines context; price reveals response.
Author

Denis Joeli Fatiaki
Independent Analyst
Denis Joeli Fatiaki possesses over a decade of extensive experience as a multi-asset trader and Market Strategist.


