Silver depends on two metals that just fell
Peru's Antamina produced 62% less zinc last quarter, not because the orebody ran out but because the mine plan called for copper, and the silver in that ore left with it.
That is the central problem with silver supply, visible in one mine. Nobody at Antamina decided to produce less silver. They decided to feed the mill a different rock, and 73.9% of the world's mined silver comes out of decisions like that one. On August 26 the International Lead and Zinc Study Group published data that puts a global figure on the metals silver rides along with.
Most silver is mined by companies that are not looking for silver
Start with where silver actually comes from, because the split is not what most silver marketing implies.
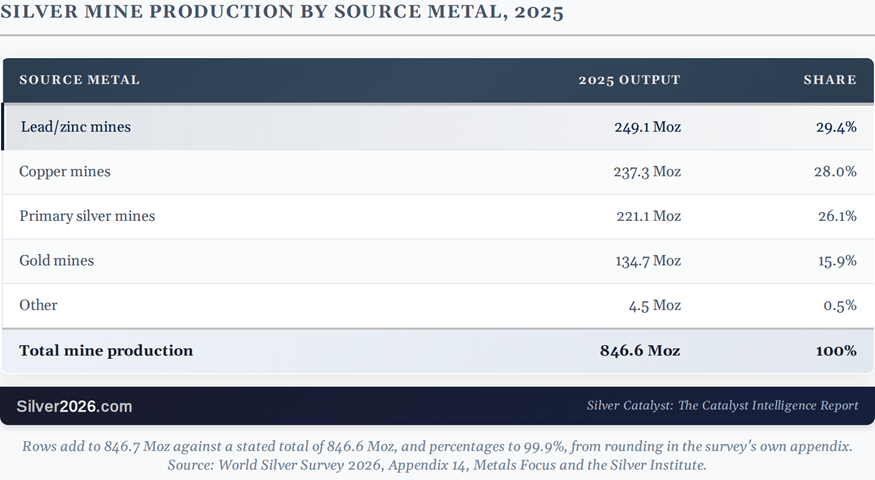
Sources:World Silver Survey 2026, Appendix 14, Metals Focus and the Silver Institute
The rows add to 846.7 Moz against a stated total of 846.6 Moz, and the percentages to 99.9%, both from rounding in the survey's own appendix.
Only 26.1% of the world's mined silver comes from mines that exist to produce silver. The rest arrives as a credit alongside something else, and the largest single source is lead and zinc mines at 249.1 Moz. When a zinc mine decides how much ore to process, it is also deciding, without thinking about it, how much silver reaches the market that year.
That is why the price signal breaks. A higher silver price is supposed to bring out more supply. It cannot do much when nearly three quarters of the metal is produced by operators whose budgets, mine plans and board decisions all turn on the price of something else.
From company filings to a global data series
Until late August, that argument rested on individual company filings: a seismic event at a Swedish mine, an ore-mix change at a Peruvian one, a closure in Australia. All of it real, none of it adding up to a measurement of the whole market.
Then the International Lead and Zinc Study Group published its first-half 2026 data. World zinc mine production fell 2.6%. World lead mine production fell 3.0%. The two metals that between them account for the largest single source of byproduct silver fell together in the same six months, with the declines concentrated in the biggest producers and only partly offset by increases elsewhere.
Two details give that more weight than a single half-year print usually deserves.
The first is that it reverses direction. The same monthly series had recorded 1.1% growth through May, so this is a turn rather than a continuation. EBC, reading the same data, puts the largest zinc reductions at Antamina in Peru, Garpenberg in Sweden and Red Dog in the United States, with Australia's Lady Loretta closing at the end of 2025 removing more tonnage.
The second is a price. Spot treatment charges for imported zinc concentrate in China reached a record low near minus $117.50 a dry tonne in August, on Shanghai Metals Market's index, against an $85 annual benchmark. A treatment charge is what a smelter earns for turning ore into metal. When it goes negative, the smelter is paying the miner for the right to process the ore, and its margin then depends on byproducts including silver rather than on the fee itself. That is what a genuine shortage of concentrate looks like when it shows up in a number rather than in commentary.
What that is worth in ounces, and what it is not
Here is the arithmetic, with a caution attached that matters as much as the figures.
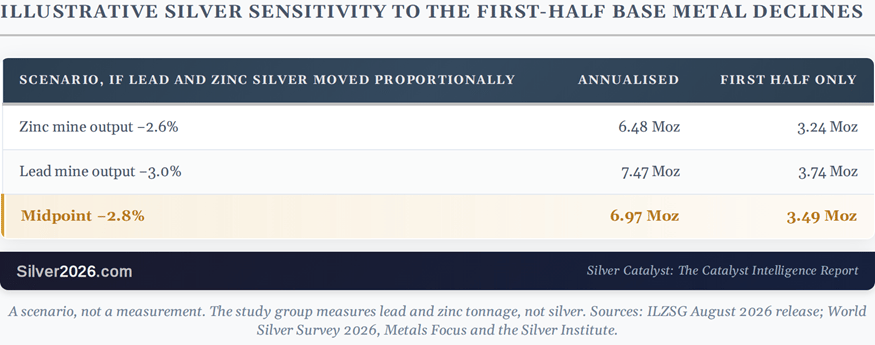
Sources:ILZSG August 2026 press release | World Silver Survey 2026, Metals Focus and the Silver Institute
The study group measures lead and zinc tonnage. It does not measure silver. The table above applies those percentage changes to last year's silver base, which makes it a scenario rather than a measurement, and the midpoint is a plain average of the two rather than a silver-weighted figure. Silver grades vary between mines, and they do not always move with tonnage.
Boliden's revised plan for Garpenberg shows why that caveat is needed. After a seismic event in March, 2026 guidance moved to 1.5 million tonnes milled at 100 grams of silver per tonne, from 3.7 million tonnes at 95 grams. Tonnage fell 59% while the silver grade guidance went up. The measured figure for 2026 arrives in next year's survey, not this one, and I will record it in the Silver Catalyst when it does, whichever way it goes.
What this means to Silver investors
On the supply side this is good for silver, and it is worth being precise about which part is good.
The mechanism now has better evidence behind it. Two mine supply series falling together, in the ore types that carry the most byproduct silver, is the first time this argument has rested on a primary global statistical release rather than on a run of company disclosures. A record-low negative treatment charge is a market price saying the same thing.
The scale is smaller than the headline suggests. Roughly 7 Moz annualised at the midpoint is 0.83% of the 844.1 Moz of mine supply that Metals Focus and the Silver Institute forecast for 2026. It does not break the market this year, and it should not be presented as though it does.
What it does change is the shape of the problem. The market is running into a sixth consecutive year of structural deficit, forecast at 46.3 Moz for 2026 by Metals Focus and the Silver Institute. The ordinary way a shortage resolves is that a higher price pulls out more supply. This data shows why that route is partly closed: a higher silver price does not directly determine output at these lead and zinc operations, because none of the people running them is deciding anything based on it.
The honest counterweight is that Western inventories have not tightened. COMEX registered stock rose over the past month, London vaults built for a third consecutive month to 28,213 tonnes at the end of July, and the September futures contract reached first notice day without visible stress. Whatever is happening in the ore is not yet showing up in the metal that Western buyers can touch. That gap is the thing to watch, and it is why the Convergence Score I publish in each issue records evidence against the argument in the same place as evidence for it. It did not move this time, for exactly that reason.
Byproduct dependency is one dimension of the 100-catalyst framework I analyze in Silver Rising, alongside the five other Deep Dives in this issue of the Silver Catalyst newsletter. If you've at least considered investing in silver, I strongly encourage you to sign up, because it takes just $1 to get both. Get full Silver Catalyst Newsletter and Silver Rising book for $1 today.
Want free follow-ups to the above article and details not available to 99%+ investors? Sign up to our free newsletter today!
Author

Przemyslaw Radomski, CFA
Gold Price Forecast
Przemyslaw Radomski, CFA (PR) is a precious metals investor and analyst who takes advantage of the emotionality on the markets, and invites you to do the same. His company, Sunshine Profits, publishes analytical software that any
















