|

Short term Elliott Wave sequence in GBP/JPY calling further upside [Video]

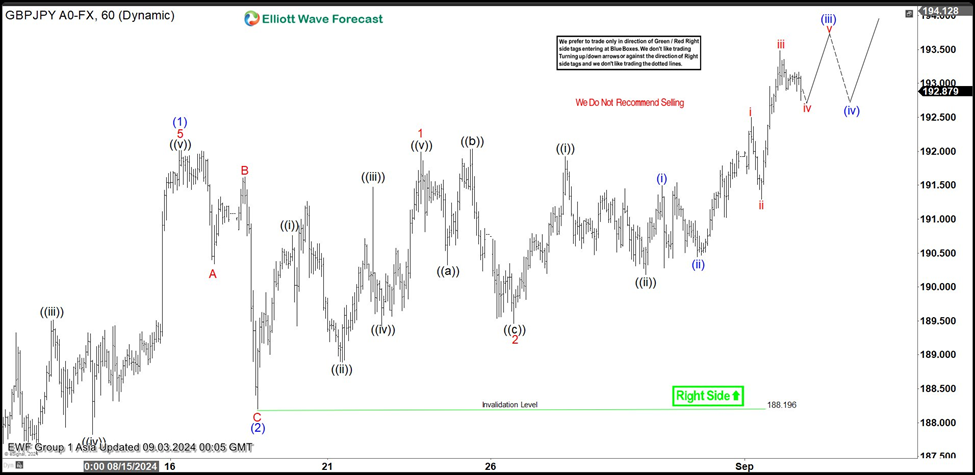
Short Term Elliott Wave in GBPJPY shows a bullish sequence from 8.5.2024 low, favoring further upside. Rally from 8.5.2024 low is unfolding as a 5 waves impulse. Wave (1) higher ended at 192.01. Pullback in wave (2) unfolded as a zigzag Elliott Wave structure like the 1 hour chart below shows. Down from wave (1), wave A ended at 190.34 and rally in wave B ended at 191.625. Wave C lower ended at 188.19 which completed wave (2) in higher degree. The pair extended higher in wave (3). Up from wave (2), wave ((i)) ended at 190.76 and dips in wave ((ii)) ended at 188.89. Wave ((iii)) higher ended at 191.47 and wave ((iv)) ended at 189.42. Final leg wave ((v)) ended at 192 which completed wave 1 in higher degree.

Pullback in wave 2 ended at 189.46 with internal subdivision as expanded flat. Up from there, wave 3 is in progress as an impulse. Wave ((i)) of 3 ended at 191.92 and wave ((ii)) of 3 ended at 190.18. Pair is nesting higher in wave ((iii)) with wave (i) ended at 191.49 and wave (ii) ended at 190.44. Expect wave (iii) to end soon, followed by wave (iv) pullback before it resumes higher again. Near term, as far as pivot at 188.19 low stays intact, expect dips to find support in 3, 7, 11 swing for further upside.

GBP/JPY 60 minutes Elliott Wave chart

GBP/JPY Elliott Wave video

Author

Elliott Wave Forecast Team

Elliott Wave Forecast Team

ElliottWave-Forecast.com

More from Elliott Wave Forecast Team
Share:

Markets move fast. We move first.

Orange Juice Newsletter brings you expert driven insights - not headlines. Every day on your inbox.

By subscribing you agree to our Terms and conditions.

Editor's Picks

EUR/USD could test 1.1750 amid strengthening bullish bias

EUR/USD remains flat after two days of small losses, trading around 1.1740 during the Asian hours on Thursday. On the daily chart, technical analysis indicates a strengthening of a bullish bias, as the pair continues to trade within an ascending channel pattern.

GBP/USD consolidates above mid-1.3300s as traders await BoE and US CPI report

The GBP/USD pair struggles to capitalize on the overnight bounce from the 1.3310 area, or a one-week low, and oscillates in a narrow band during the Asian session on Thursday. Spot prices currently trade around the 1.3370 region, down less than 0.10% for the day, as traders opt to wait on the sidelines ahead of the key central bank event risk and US consumer inflation data.

Gold awaits weekly trading range breakout ahead of US CPI report

Gold struggles to capitalize on the previous day's move higher back closer to the $4,350 level and trades with a mild negative bias during the Asian session on Thursday. The downtick could be attributed to some profit-taking amid a US Dollar uptick, though it is likely to remain cushioned on the back of a supportive fundamental backdrop. 

Dogecoin breaks key support amid declining investor confidence

Dogecoin trades in the red on Thursday, following a 4% decline on the previous day. The DOGE supply in profit declines as large wallet investors trim their portfolios. Derivatives data shows a surge in bearish positions amid declining retail interest.

Monetary policy: Three central banks, three decisions, the same caution

While the Fed eased its monetary policy on 10 December for the third consecutive FOMC meeting, without making any guarantees about future action, the BoE, the ECB and the BoJ are holding their respective meetings this week. 

Dogecoin Price Forecast: DOGE breaks key support amid declining investor confidence

Dogecoin (DOGE) trades in the red on Thursday, following a 4% decline on the previous day. The DOGE supply in profit declines as large wallet investors trim their portfolios. Derivatives data shows a surge in bearish positions amid declining retail interest.