Shocker: Inflation is worse than the government data reveals

You can file this under things you already knew.
Price inflation is worse than the official data indicates.
Based on the Consumer Price Index (CPI), price inflation is running at 2.9 percent, with core inflation a little hotter at 3.1 percent. Both numbers are far above the mythical 2 percent target, but the situation is even worse for real people trying to live real lives.
Gene Ludwig served as Comptroller of the Currency under President Bill Clinton, and he recently wrote a book titled “The Mismeasurement of America: How Outdated Government Statistics Mask the Economic Struggle of Everyday Americans.” He asserts that the CPI is “not tremendously relevant to the lived experience of middle and low-income Americans.”
The CPI encompasses some 80,000 goods and services, from baby formula to college tuition. However, most people don’t purchase the vast majority of the things captured by the CPI.
“If we’re going to have a number that is relevant to them, it’s got to be a smaller group of items that matter to their lives.”
A Bloomberg article summed it up this way:
“The problem with this dependence on a single indicator is that not all Americans experience inflation the same way. The CPI includes many items beyond the reach of working families, such as sports tickets, air travel, second homes and golf carts. If the costs of basic necessities such as rent and medical care rise faster than those of nonessential goods, the index may not truly reflect the reality many households face.”
Ludwig and his team came up with an alternative measure called the True Living Cost (TLC). The metric only includes minimal household needs such as housing, transportation, food, medical care, childcare, along with necessary items as cell phones, clothing, and items for personal hygiene.
Since 2001, the TLC has risen 1.3 times faster than the CPI.
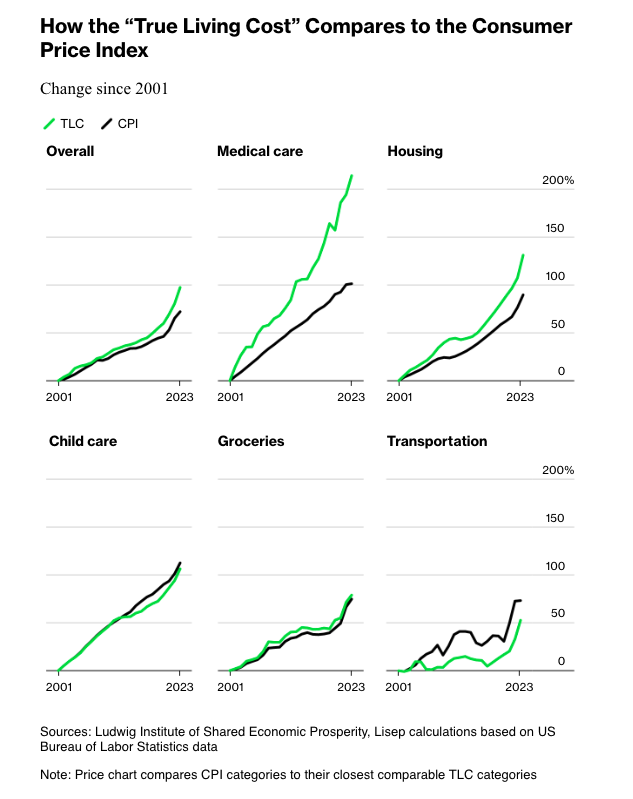
The TLC not only includes a smaller range of items. It also uses a different methodology. For instance, to calculate housing costs, the TLC uses data on fair market rents instead of the made-up “owners’ equivalent rent” calculation employed by the CPI.
This raises another issue with the government CPI data. It is intentionally formulated to understate rising prices.
The government revised the CPI formula in the 1990s so that it understated the actual rise in prices. Based on the formula used in the 1970s, CPI is nearly double the official numbers. So, if the BLS used the old formula, we’d be looking at CPI closer to 6 percent. And using an honest formula, it would probably be worse than that.
It's notable that when you inflation-adjust wages using the TLC, they have fallen over the past 20 years. This represents a real erosion of the average person’s purchasing power. We see the devaluation of the government's paper money in the rapid upward trajectory of the price of real money - gold and silver.
The bottom line is inflation is real. And it’s worse than they’re telling you.
To receive free commentary and analysis on the gold and silver markets, click here to be added to the Money Metals news service.
To receive free commentary and analysis on the gold and silver markets, click here to be added to the Money Metals news service.
Author

Mike Maharrey
Money Metals Exchange
Mike Maharrey is a journalist and market analyst for MoneyMetals.com with over a decade of experience in precious metals. He holds a BS in accounting from the University of Kentucky and a BA in journalism from the University of South Florida.


