|

Seven red days for USD/CHF: A prelude to more decline?

In today's deep dive, let's shift our attention to the American Dollar to Swiss Franc (USDCHF) pairing, currently in anticipatory limbo as it awaits key inflation data from the U.S. A swift glance at the chart unveils a distinctly bearish aura, underscored by a relentless string of seven consecutive bearish candles. Such a sequence hasn't graced the charts in a significant amount of time, underscoring the magnitude of this bearish momentum.

Zooming out, this bearish procession is part of a larger technical narrative – the double top formation, highlighted in yellow. This formation, renowned in technical analysis circles as a bearish reversal pattern, has its neckline firmly positioned at 0.91 (green). This level stands tall as a pivotal horizontal support for USDCHF. The decisive breach below this mark amplifies the bearish sentiment, and it's not surprising that this rupture ignited a more pronounced downward thrust.

USDCHF

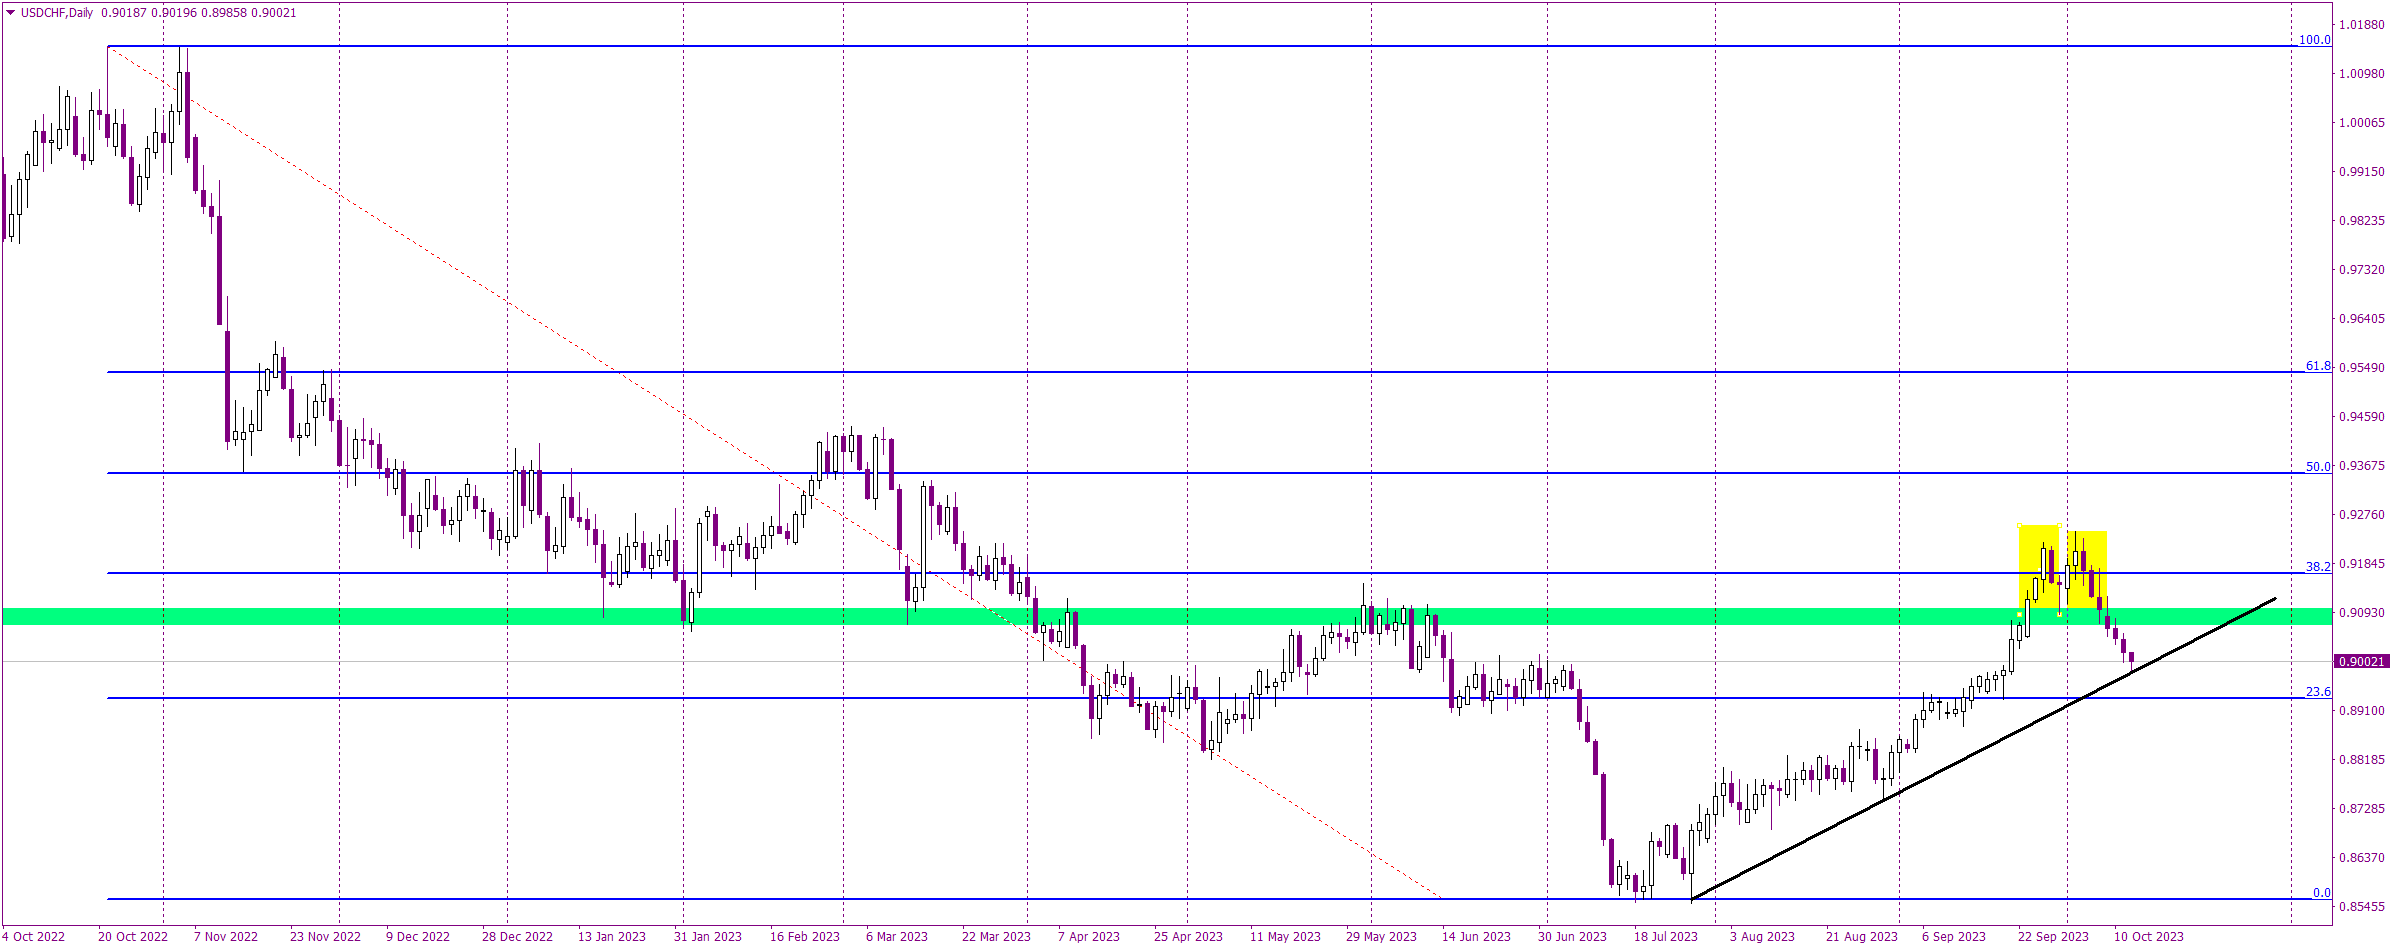
However, all hope isn't lost for the bulls. Nestled within this bearish tableau is a glimmer of hope – the black uptrend line. This line, charting the trajectory of higher lows since late July, emerges as a last bastion of support for the pair.

So, where does this leave traders? With inflation numbers in the offing, heightened volatility is almost a given. A scenario where the price rebounds off the black line, forging a hammer candlestick pattern and embarking on an upward journey, signals a buying opportunity. Conversely, should the pair capitulate below this line, sealing the day's trade beneath it, that's a clarion call for a short position.

Author

Tomasz Wisniewski

Tomasz Wisniewski

Axiory Global Ltd.

Tomasz was born in Warsaw, Poland on 25th October, 1985.

More from Tomasz Wisniewski
Share:

Markets move fast. We move first.

Orange Juice Newsletter brings you expert driven insights - not headlines. Every day on your inbox.

By subscribing you agree to our Terms and conditions.

Editor's Picks

EUR/USD clings to small gains near 1.1750

Following a short-lasting correction in the early European session, EUR/USD regains its traction and clings to moderate gains at around 1.1750 on Monday. Nevertheless, the pair's volatility remains low, with investors awaiting this weeks key data releases from the US and the ECB policy announcements.

GBP/USD edges higher toward 1.3400 ahead of US data and BoE

GBP/USD reverses its direction and advances toward 1.3400 following a drop to the 1.3350 area earlier in the day. The US Dollar struggles to gather recovery momentum as markets await Tuesday's Nonfarm Payrolls data, while the Pound Sterling holds steady ahead of the BoE policy announcements later in the week.

Gold stuck around $4,300 as markets turn cautious

Gold loses its bullish momentum and retreats below $4,350 after testing this level earlier on Monday. XAU/USD, however, stays in positive territory as the US Dollar remains on the back foot on growing expectations for a dovish Fed policy outlook next year.

Solana consolidates as spot ETF inflows near $1 billion signal institutional dip-buying

Solana price hovers above $131 at the time of writing on Monday, nearing the upper boundary of a falling wedge pattern, awaiting a decisive breakout. On the institutional side, demand for spot Solana Exchange-Traded Funds remained firm, pushing total assets under management to nearly $1 billion since launch. 

Big week ends with big doubts

The S&P 500 continued to push higher yesterday as the US 2-year yield wavered around the 3.50% mark following a Federal Reserve (Fed) rate cut earlier this week that was ultimately perceived as not that hawkish after all. The cut is especially boosting the non-tech pockets of the market.

Solana Price Forecast: SOL consolidates as spot ETF inflows near $1 billion signal institutional dip-buying

Solana (SOL) price hovers above $131 at the time of writing on Monday, nearing the upper boundary of a falling wedge pattern, awaiting a decisive breakout.