Samsung’s Breakaway Gap – The Beginning Of Something Larger?

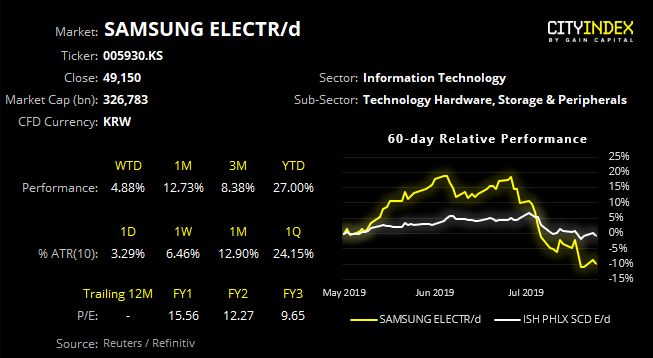
A bullish breakout gap from a multi-month reversal pattern suggests Samsung’s run could just be getting started.
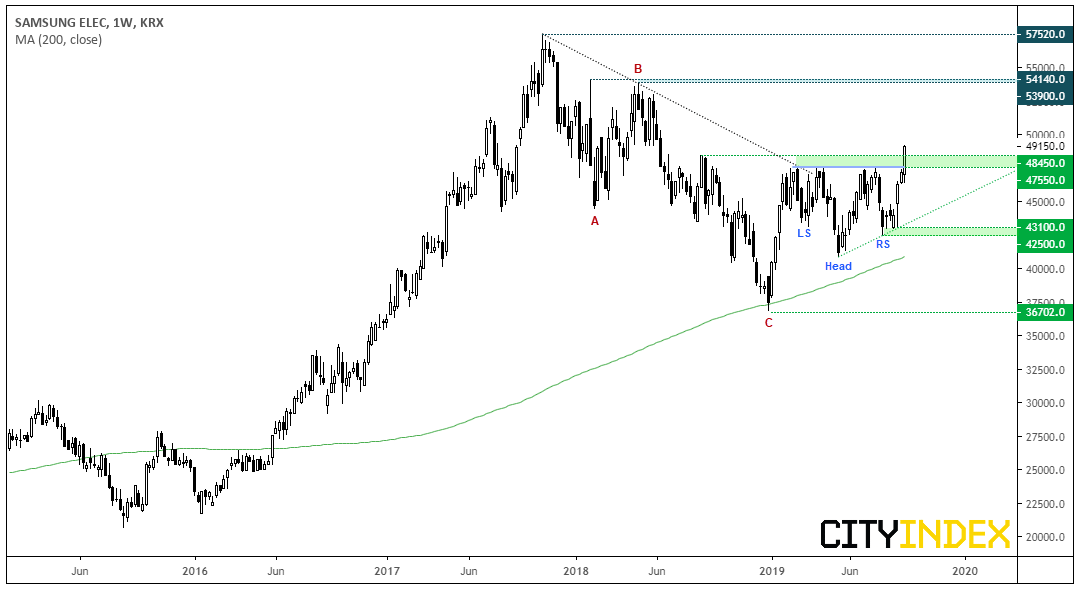
Starting on the weekly chart, Samsung enjoyed a strong bullish run throughout most of 2016 to 2018, before embarking on a 15-month correction. Coming in three distinct waves, the ABC retracement appears to have terminated at 36,850 having found support at the 200-week MA in December and bullish momentum is now back in control.
Two higher lows have formed as part of an inverted head and shoulders pattern which, if successful, projects an initial target just above the 2018 highs. This week’s breakout has confirmed the bullish reversal pattern, although if we have indeed seen the end of the 15-month ABC correction, it should be breaking to record highs over the coming months. And assuming the head is the end of wave 2 retracement, this week’s breakout assumes we’re now in a iii or 3 wave.

Switching to the daily chart shows just how strong bullish momentum is. A small bullish hammer shows a minor pullback to 46,400 ahead of a daily close above 47,750 which confirmed the head and shoulders reversal. However, a breakaway gap on above-average volume saw prices explode higher to close above 49,000 yesterday and today’s price action has also gapped higher. Granted, we could find interim resistance around 50k but, given the strength of the breakout, we don’t envisage yesterday’s gap to be filled.
- Samsung could be suitable to intraday momentum traders, or bulls who prefer to buy dips on the daily chart. Look for 48,450 to hold as support on the daily chart (or a higher low form above this key level if resistance is found around 50k).
- Alternatively, intraday traders could seek bullish positions to try and ride the current momentum ahead of 50k.
- The near-term bullish bias is invalidated with a break below 48,450
- The bullish daily trend remains valid above 46,400 (although a test of this level would invalidate the head and shoulders pattern)
Related Analysis:
Samsung Probes Key Resistance, Bulls and Bears Build Their Case
Author

Matt Simpson, CFTe, MSTA
CityIndex
Matt Simpson is a certified technical analyst who combines charts and fundamentals to generate trading themes.


