Same story, different day for Gold
Does gold resemble the S&P GSCI?
Despite their deteriorating fundamental outlooks, any whisper of a bank run sends gold, silver, and mining stocks higher. Yet, while a potential GFC re-enactment is bearish for the PMs, investors are enthusiastic to bid up the trio, despite the ominous historical implications.
So, while we can debate the merit of this behavior, the reality is that sentiment has the bulls in control. But we’ve seen this movie before, and the motion picture should turn from a comedy to a tragedy in the months ahead. To explain, we wrote on Mar. 8, 2022:
With commodities running wild amid the Russia-Ukraine conflict, the S&P Goldman Sachs Commodity Index (S&P GSCI) has become the new FAANG. And with gold, silver and mining stocks riding the momentum higher, profound pain should confront the PMs when the all-time outperformance reverses.
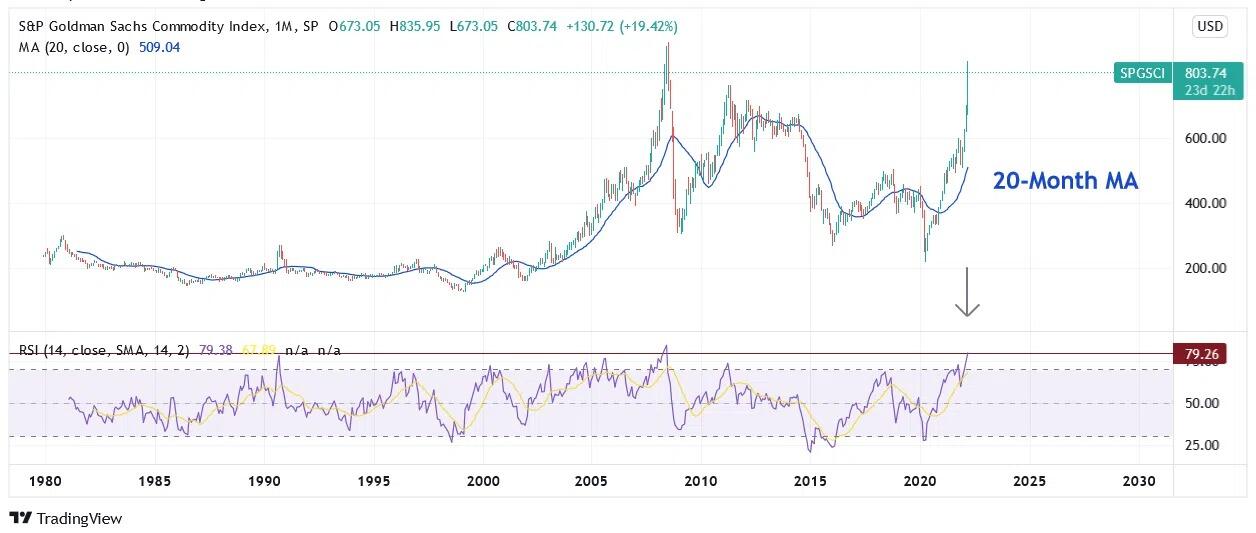
To explain, the chart above tracks the monthly performance of the S&P GSCI, while the blue line above tracks the index’s 20-month moving average, and the purple line on the bottom half of the chart tracks the index’s monthly RSI….
If you analyze the right side of the chart, you can see that the S&P GSCI is now 58% above its 20-month MA, and this is the largest outperformance on record…. As a result, the S&P GSCI has never been more disconnected from reality, and the PMs have been material beneficiaries.
To that point, while the crowd assumed a commodity supercycle was imminent, the S&P GSCI crashed, and a bear market unfolded.
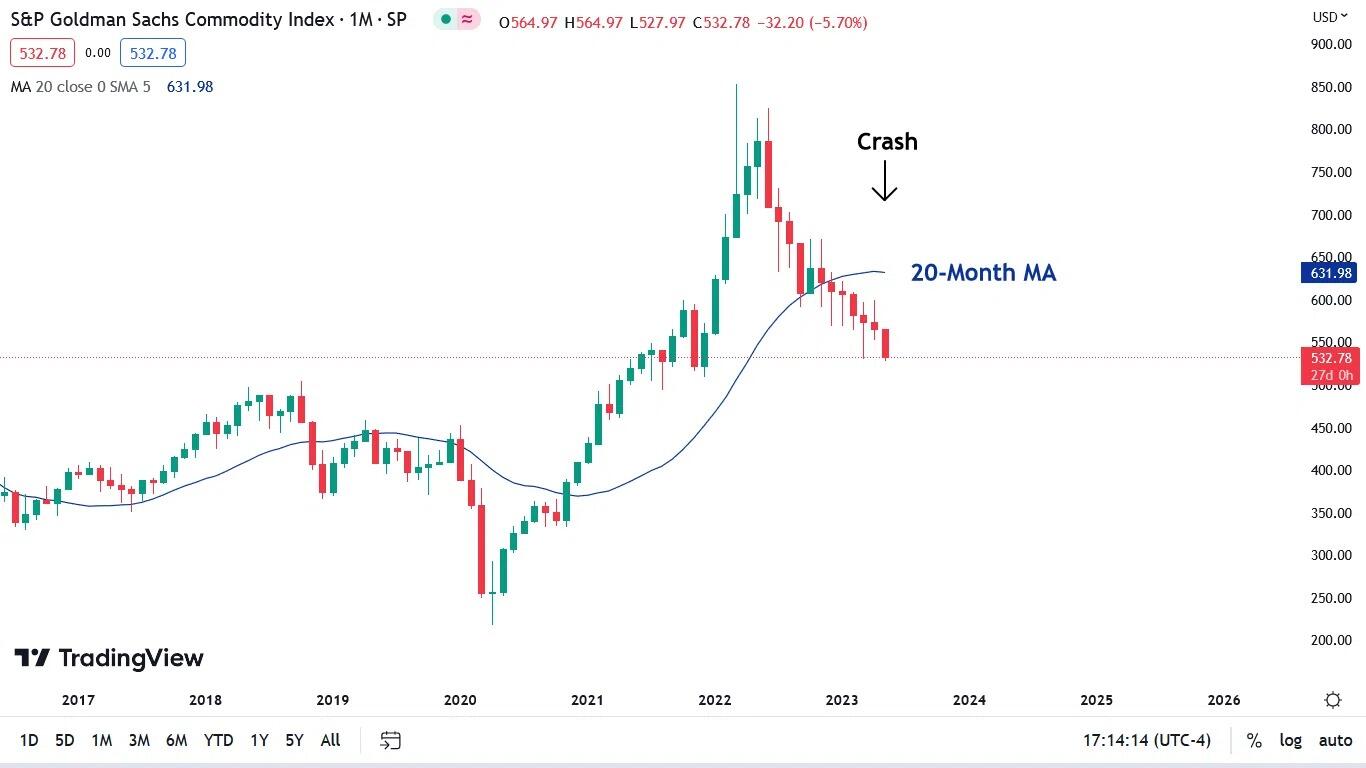
To explain, the S&P GSCI has declined by nearly 34% over the last ~14 months, which happens when euphoria decouples asset prices from their fundamental values. Similarly, gold elicits the over-optimism that preceded the S&P GSCI’s plunge.
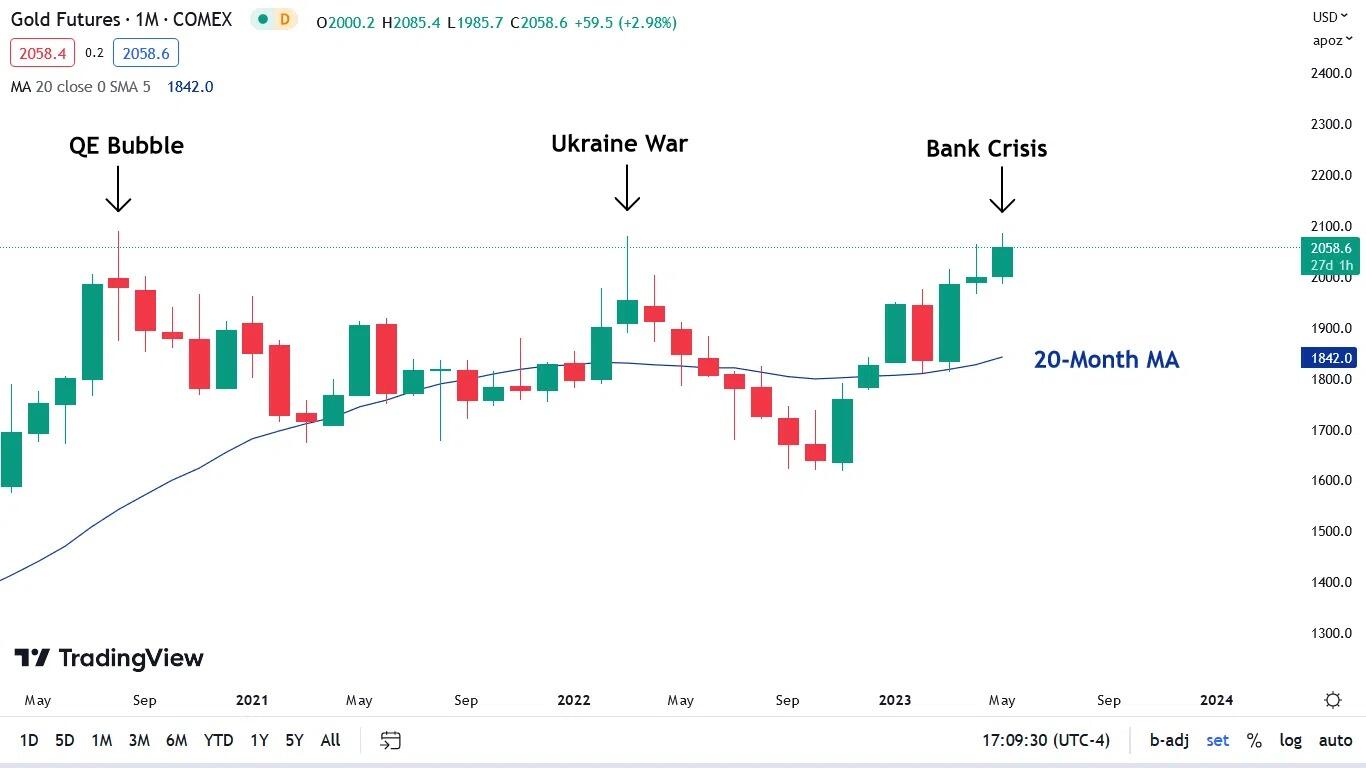
To explain, the candlesticks above track the gold futures price, while the blue line above tracks its 20-month MA. As you can see, when the yellow metal ran away from its 20-month MA during the QE bubble and the Ukraine war, breakdowns eventually followed, which mirrors the plight of the S&P GSCI.
More importantly, the rally on the right side of the chart shows how the bank “crisis” has become the new narrative creating the safe-haven bid. As such, while sentiment rules in the short term, the S&P GSCI is the perfect example of what should unfold in the months ahead.
Furthermore, while the Fed raised interest rates by 25 basis points on May 3, Chairman Jerome Powell said, “Looking ahead, we’ll take a data-dependent approach in determining the extent to which additional policy firming may be appropriate.”
But please remember that the Fed has always been data-dependent. Do you think the central bank would have raised the FFR to 4%, and now 5.25%, if inflation subsided gracefully? Of course, not. The Fed only acts if it’s necessary.
So, while the crowd assumes that Paul Volcker has left the building and rate cuts and QE are on the horizon, the fundamentals do not support their optimism.
PMI realities
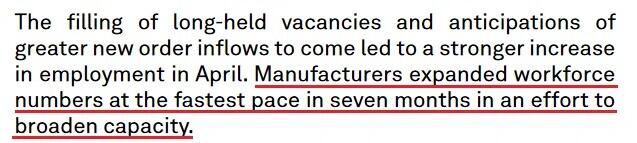
S&P Global released its U.S. Manufacturing PMI on May 1. The headline index increased from 49.2 in March to 50.2 in April, and the report stated:
“Input costs and output charges increased at steeper rates during April. Higher supplier prices reportedly drove inflation as firms passed through greater operating expenses to customers. The rate of cost inflation quickened to the sharpest in three months, while the pace of increase in selling prices also accelerated above the series average.”
On top of that, with employment growth hitting a seven-month high, the data does not support the PMs’ pivot hopes.
Likewise, S&P Global released its U.S. Services PMI on May 3. The headline index increased from 52.6 in March to 53.6 in April, and an excerpt read:
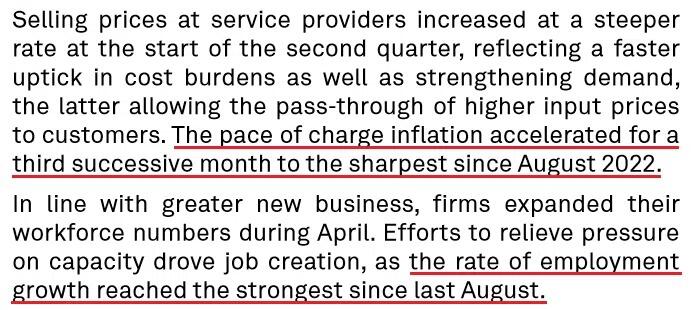
“The rate of expansion in new orders was the sharpest for almost a year…. Stronger overall demand conditions brought with it the reignition of inflationary pressures in April. Average cost burdens rose at a marked pace that was the fastest since January and historically elevated. Higher business expenses were reportedly due to hikes in supplier prices and greater salary costs.”
And surprise, surprise, output inflation and employment growth accelerated to their highest levels since August 2022.
Thus, please remember that the Fed’s dual mandate is maximum employment and price stability. And rate cuts and QE are illogical when the PMIs, inflation, and employment are accelerating. Therefore, it’s likely only a matter of time before a Minsky Moment strikes the precious metals market.
Overall, the PMs are priced as if a negative interest-rate policy (NIRP) is imminent. However, the data contrasts this narrative, and the Fed has only made small progress in cooling inflation and rebalancing the U.S. labor market. As such, while regional bank headlines provide gold, silver and mining stocks with cover, history shows they can only ride this wave for so long.
Do you believe gold will follow the S&P GSCI’s path?
Want free follow-ups to the above article and details not available to 99%+ investors? Sign up to our free newsletter today!
Want free follow-ups to the above article and details not available to 99%+ investors? Sign up to our free newsletter today!
Author

Sébastien Bischeri
Gold Price Forecast
Sebastien Bischeri is a former Reserve Officer in the French Armed Forces (Navy), and began his career in computer science and engineering, prior to move into banking, finance, and trading.
















