Safe havens of gold, yen and Treasuries perform well with equities holding on

Market Overview
Increased political risk has helped to drive investors back into safe haven assets in recent sessions. Subsequently, the classic triumvirate of gold, the Japanese yen and US Treasuries have been performing well. The move on Treasuries could be significant though yields lose to key supports as the 2 year eyes the 1.136% support whilst the 10 year is close to the 2.305% support. However, the close correlation between Treasury yields and the US Trade Weighted Dollar seems to have broken down as there are key factors impacting across the euro and sterling that are preventing the US dollar from coming under true corrective pressure. The French Presidential election fears are a drag on the euro, whilst concerns over the economic impact of Brexit and now a potential second Scottish Referendum are hampering sterling’s performance. Furthermore, traders are also eying Donald Trump’s key policy speech on Tuesday where he could give hints over his fiscal expansion plans. This pull into safe havens has been coinciding with a corrective threat on equities (especially in Europe), even though there has been an early bounce today.

Wall Street has continues to edge into no highs, with the S&P 500 +0.2% at 2367, whilst Asian markets were negative overnight with the Nikkei down -0.9%, however European markets have taken a positive open. There is a mixed bag on forex markets today, with sterling an underperformer after suggestions at the weekend of the prospect of another Scottish Independence vote. Gold and silver are supported today with oil also holding on to the recent gains.
Traders will begin a huge week, packed with tier one economic data, on a fairly quiet note. The European session has very little on the agenda, with the core US Durable Goods Orders at 1330GMT set to show how buying pressure continues to build. The core data is expected to rise by +0.5% on the month. Pending Home Sales are then at 1500GMT which are expected to grow by +1.1% on the month. There is also FOMC member Robert Kaplan who is due to speak at 1600GMT.
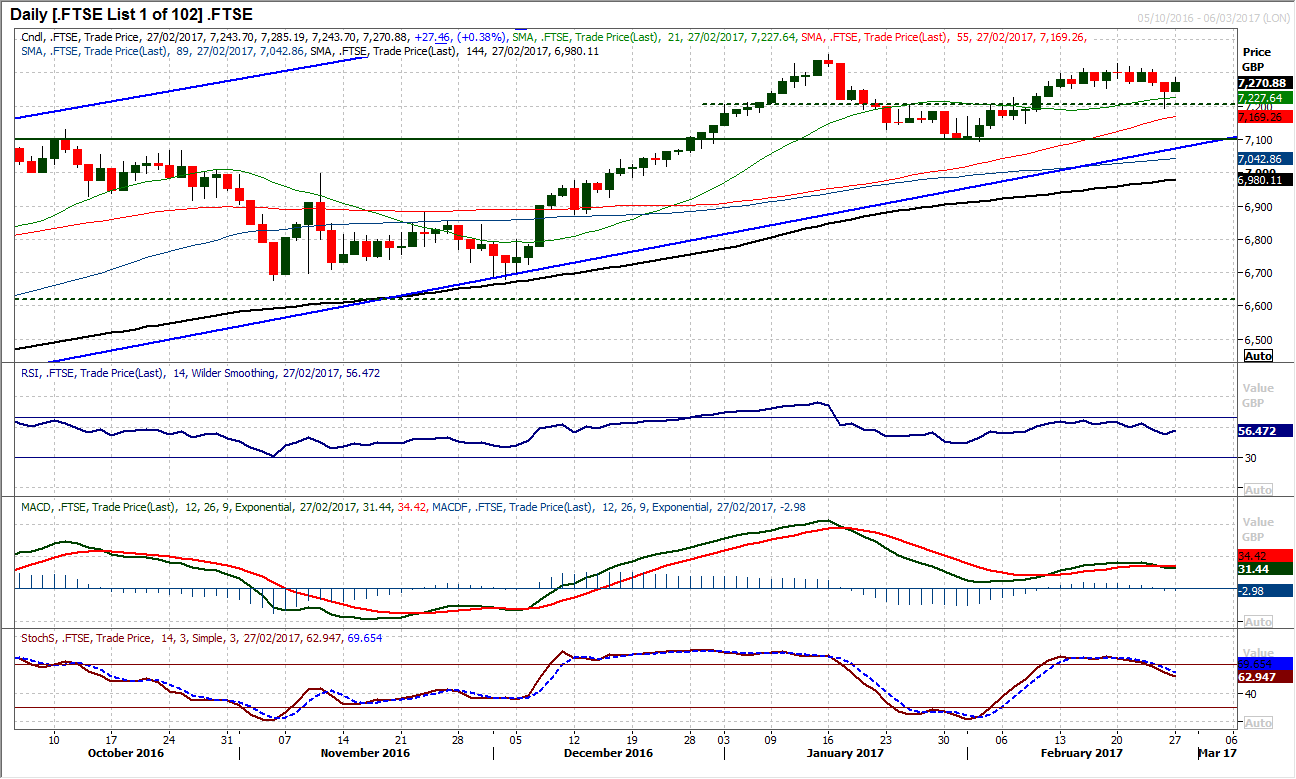
Chart of the Day – FTSE 100
The corrective move on equities came as the FTSE fell back from 7330 and made a near term break below the initial support at 7253 on Friday. This could now open the potential for a near term correction. The momentum indicators are turning corrective with the Stochastics bear cross now confirming a near term sell signal (or should that be profit trigger?), whilst the MACD lines are also crossing lower. This could now pull near term dip in FTSE, but there is a pivot support around 7200 which broadly held on Friday (Friday’s low was 7192) and will continue to be a key gauge in the coming days. The key support is around 7100 (the early February low was 7093) which will also become the support of the key long term uptrend that has been in place for the past nine months. The hourly chart shows a small top pattern that implies 7175, whilst there is a key support at 7148.
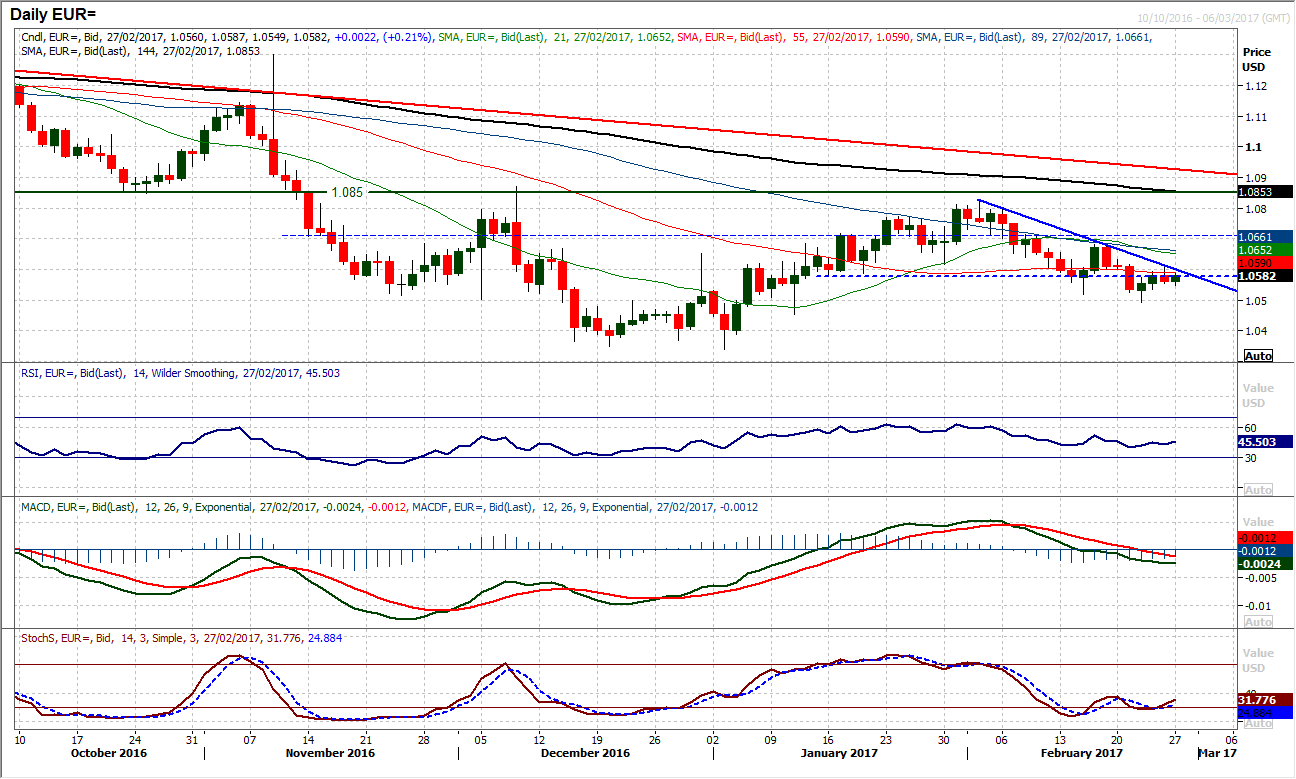
EUR/USD
The euro continues to build on its trend of over three weeks as Friday’s intraday rally again hit the underside resistance of the downtrend only to fall away again. Forming a negative one day candlestick that also found resistance in the old support band turned resistance at $1.0577/$1.0617 means that the bears remain in control. The momentum indicators retain a moderately bearish configuration with the RSI stuck in the low 40s, the MACD lines falling below neutral and the Stochastics bumping along around 20/30. Rallies remain a chance to sell. The hourly chart indicators remain in negative configuration without being overtly bearish. The minor consolidation in the early part of today’s session has support above initial support at $1.0535, but a breach would re-open the $1.0490 low. Resistance is at $1.0617.
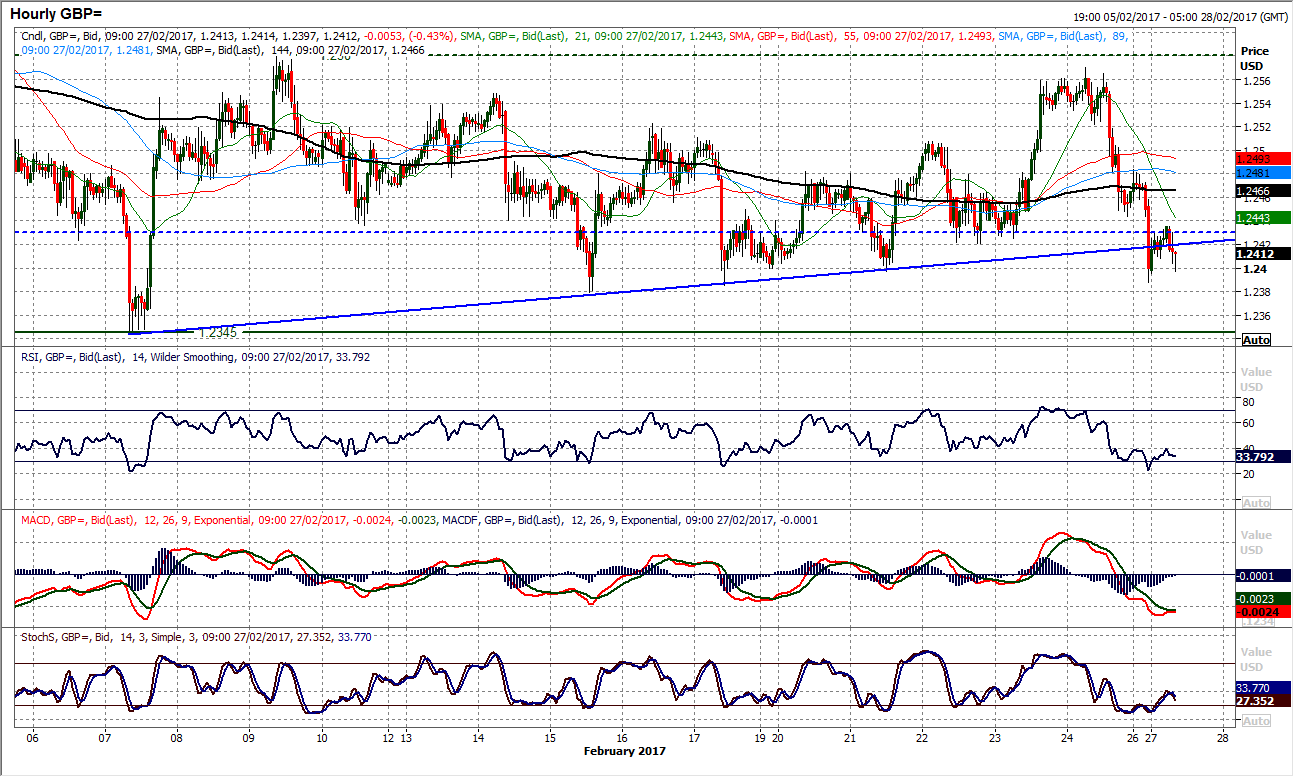
GBP/USD
Yet again, a move to break the shackles has been rebuffed and the market is back to trading around the old $1.2430 pivot. The strongest bull candle since late January was posted on Thursday which looked to be set to drive a break from the consolidation, only to be unwound by an entire retracement move. The improvement in the momentum indicators have been snuffed out with RSI back below 50 and MACD lines falling again. The hourly chart shows that this is though just part of a range play that has formed in the past few weeks between $1.2345/$1.2580. The converging trend lines have now both been broken and once more the hourly momentum indicators (especially the RSI) are oscillating, which reflects a continued trading range. The support is in place just above $1.2380 which protects $1.2345 now. Resistance is initially $1.2490/$1.2510 under $1.2580.
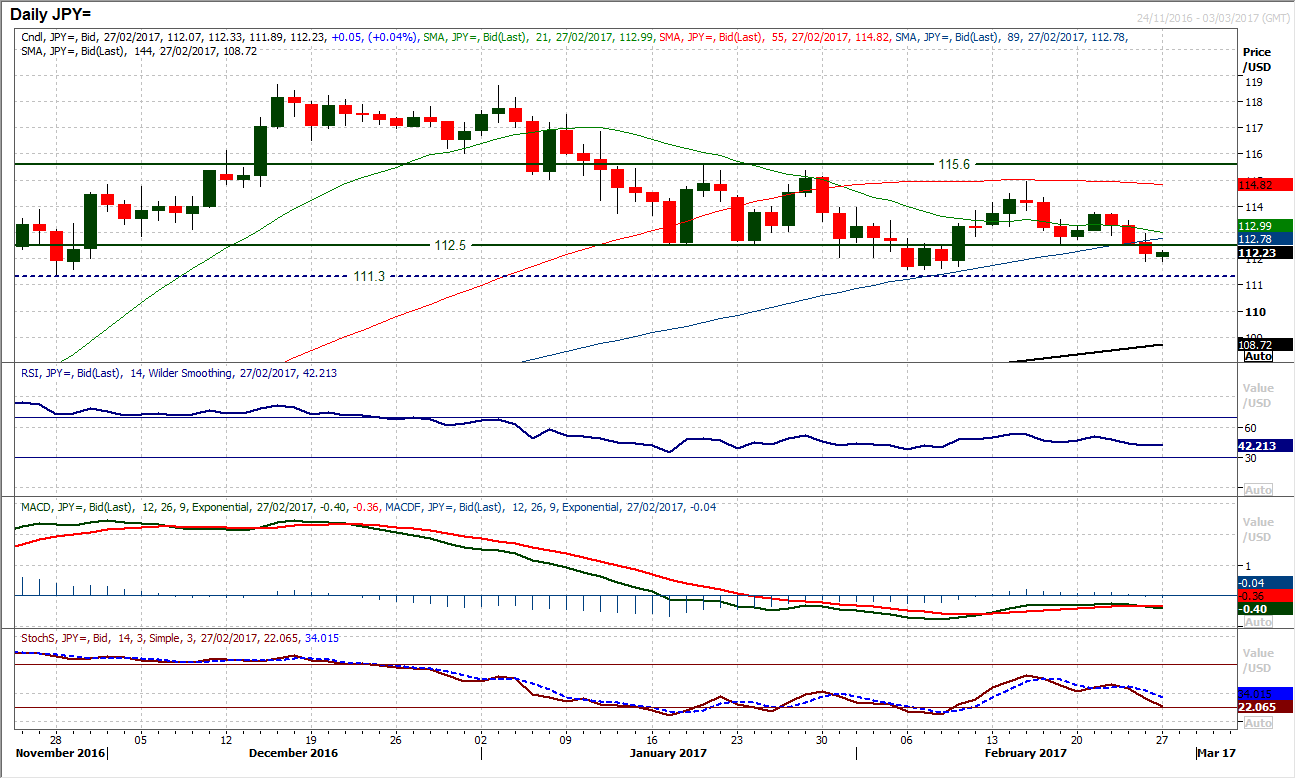
USD/JPY
The dollar bulls continue to struggle and now a break back below 112.50 means that the positive yen outlook is gaining strength once more. The close on Friday was a two week low and with the momentum indicators deteriorating again, the pressure is mounting for a challenge on the key support at 111.60. Taken across the course of the past couple of months, there is a sequence of lower highs which have been left and with the negative medium term configuration on the momentum indicators this just reflects that the rallies are still being sold into, leaving 113.77 as another key resistance. The 112.50 old pivot now becomes a basis of resistance once more today, whilst the hourly chart shows that intraday rallies are just helping to unwind momentum to use as a chance to sell. The hourly RSI into 50/60 has been limiting for the past four sessions now. Expect further pressure on 113.60, with support at 113.20 of long term significance.
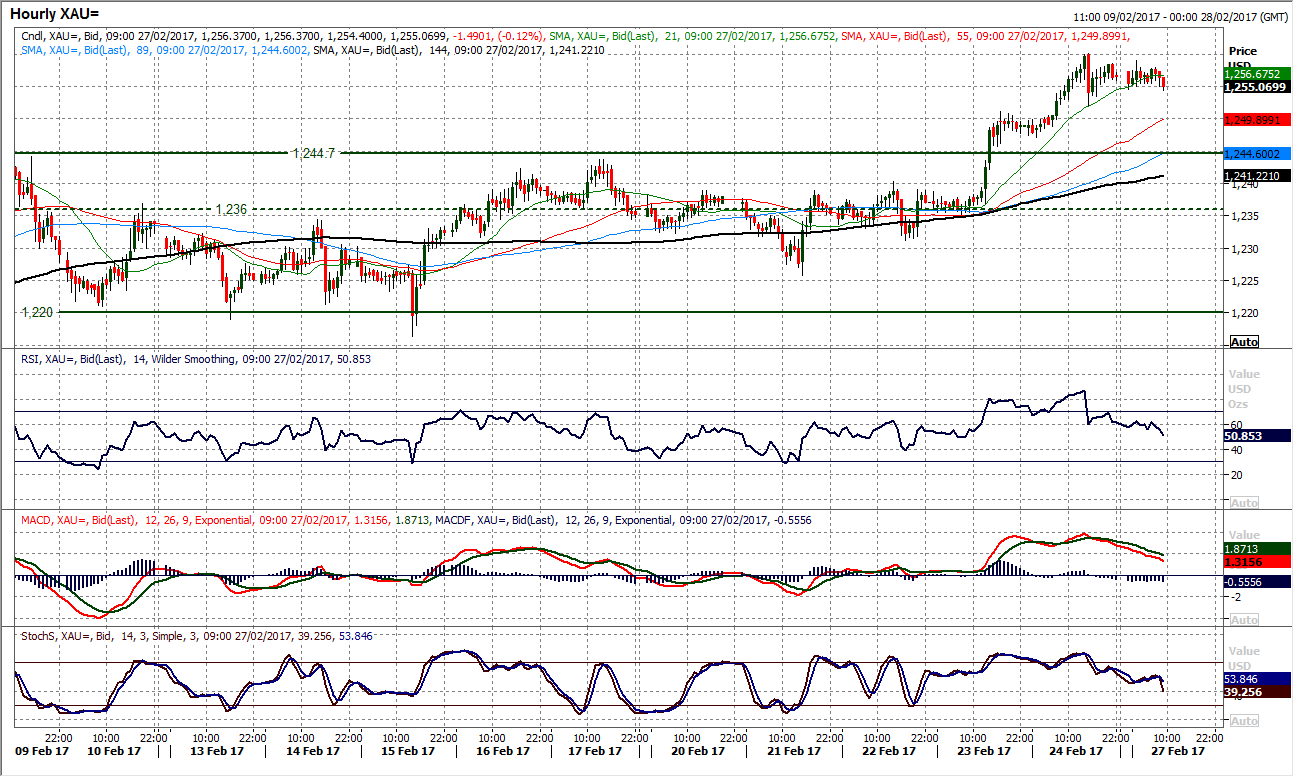
Gold
Gold has once more used the consolidation built over a multi-week period as an opportunity to build for the next upside break. This breakout was completed on Thursday and confirmed by Friday’s break and the breakout implies $1268 from the near term consolidation pattern. Momentum is strong but the RSI is now at 70 again and in the past 12 months this has tended to be restrictive of immediate upside potential which could mean that a minor corrective move that gives a better entry in the next day or so. The hourly chart shows initial support around $1247/$1252 whilst $1244.70 is the breakout support. There is little significant resistance until $1280/$1300 with the long term downtrend today in at $1285.
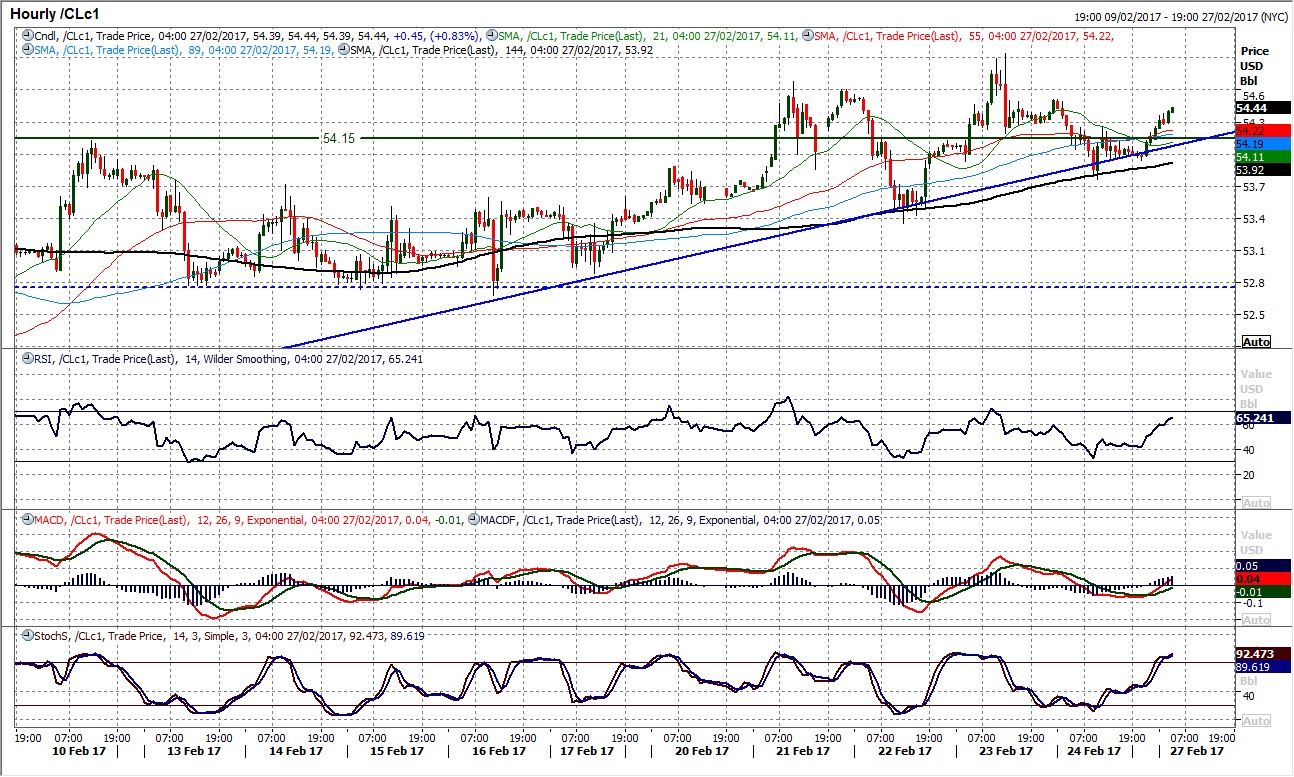
WTI Oil
It is interesting to see that the technical configuration on WTI is more positive than Brent Crude. Whilst Brent Crude has been unable to push for a technical breakout, WTI has been building the basis of support for a bullish move through the top of the range. The support of a trend in place over the past three weeks which continues to underpin the higher lows on WTI, whilst the momentum indicators remain positive. The bulls will be happy to find the Stochastics in positive configuration, however the RSI is still stuck below 60 and this would still be a positive indication if it were to be seen. The break above $54.00 seems to be more of a consistent move that is accepted now, whilst the hourly chart shows the support around $53.35 grows with Friday’s low at $53.75 as the 144 hour moving average (c. $53.90) increasingly supports and underpins the move higher. The hourly RSI holding above the mid-30s and pushing towards 70 reflects the building positive bias. The resistance is at $54.50 and $54.95 which now protects $55.25.
Author

Richard Perry
Independent Analyst
Richard Perry, Independent Market Analyst, has over 20 years of experience working in financial markets in London.


