Repeating the 1970s lost decade

Are we about to repeat the lost decade of the 1970's?
Today’s stagflationary economy -- with high inflation and slow growth -- will look familiar to anybody who lived through the 1970’s.
Not only the stagflation, but the social unrest, decaying cities and political polarization all feel eerily familiar to those who thought gas lines, bell bottoms, and Captain and Tennille were all behind us.
For the past year my base case has been that we're repeating the 1970's economy. The most salient feature of which was a double-peak stagflation that ultimately lasted roughly 8 years.
Perhaps this time paired with a 2008-style financial crisis that will ultimately convert into even more inflation.
What happened in the 70’s?
The story starts in the late 1960’s, when the federal government went with “guns and butter.” Meaning enormous welfare spending on Lyndon B Johnson’s “great society” on top of the Vietnam war and the other myriad wars our military industrial complex demands.
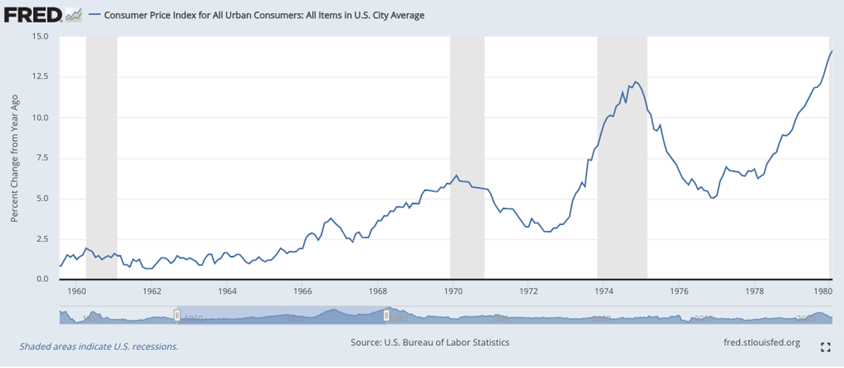
Guns and butter drove up inflation: It had averaged around 1% from 1952 to 1964, but started rising in 1965, hitting nearly 5% by 1968 and 6.5% by 1970.
At the time foreign countries could redeem their dollars for gold held by the US government. America’s inflation led these countries to fear the dollar would be worth less in future, so they began selling their dollars for gold. Most notably France, which sent a battleship to pick up 92% of the reserves they’d parked with the US in 1940 to pay for warplanes.
At this point Nixon could have tried to cut spending to reassure other countries — and reassure the American people — that the dollar was solid. Instead, of course, he “temporarily” suspended gold conversion. Which effectively killed the gold standard that had acted as that last constraint on US deficits and money printing.
As always when the government breaks something, 53 years later we’re still under that “temporary” suspension.
From Nixon to stagflation
Once Nixon broke gold conversion, the gloves were off. Nixon's Shock led to a decline in inflation for a single year, at which point it began a relentless march up, hitting 12% by 1974.
By the way, the Arab oil embargo, which is widely scapegoated for the 1970's inflation and was in response to US support for Israel, didn't even start until inflation was already 8%. It certainly didn't help quadrupling oil prices, but inflation was already soaring -- oil just piled on.
Facing 12% inflation, like today the Fed furiously hiked rates. Which did bring down inflation for a couple years. At the cost of a savage recession as the private sector was choked off -- note that, like today, government spending didn't fall, just private spending. In the first quarter of 1975 the economy contracted by 5% annualized, reported at the time about twice that.
This scared the Fed, which is constantly walking a tightrope between public anger about the inflation they cause and public anger about the recessions they cause. So the Fed pulled back and allowed rates to plunge once again into negative territory.
This sent inflation soaring again -- the infamous "camelback" shape I talk about in the daily videos.

The second stagflation
This second inflation was actually much worse than the first, lasting almost twice as long -- more than 5 years versus the original 3 years — and hitting even higher levels of price increases.
At the time commenters worried that inflation might be permanent.
But it was at that moment that the country got the hero it needed: Fed Chair Paul Volcker. Ironically appointed by the inflationist Jimmy Carter, Paul set to work hiking rates to previously unimaginable levels, hitting 17% by 1980 and 19% by 1981.
This, predictably, set off a series of savage recessions that cost Carter the presidency -- unemployment hit 10% and stayed there for a year. But public anger over inflation had gotten to the point that medicine was needed, and indeed 19% rates finally killed the inflation, leading to the "Morning in America" economy of the 1980's.
The 1970’s were brutal for workers, they were brutal for households struggling to buy food, and it was brutal for investors — adjusting for inflation, stocks didn’t recover until 1995. They held up better than dollars, of course, which never recovered.
At the same time, the 70’s were harmless, even glorious, for any investor who held real assets. Housing kept up with inflation, as it tends to do, and given cheap Fed money going into the 70’s homeowners actually came out ahead.
Meanwhile, gold went up 15-fold, even faster than oil. Silver went up 8-fold. We can only imagine what Bitcoin might have done.
Lessons for today
My biggest fear is that if we’re reliving the 1970's it could last a lot longer this time. For two reasons: Volcker and Debt.
First, Volcker. We’re very unlikely to get another savior because Paul Volcker was, from Washington's perspective, a huge mistake. His boss lost his job. In fact his party — the Democrats — lost their near 50-year monopoly on the Senate as control flipped durably for the first time since the Great Depression.
Washington won’t make that mistake again. Next time they’ll kick the can as long as possible.
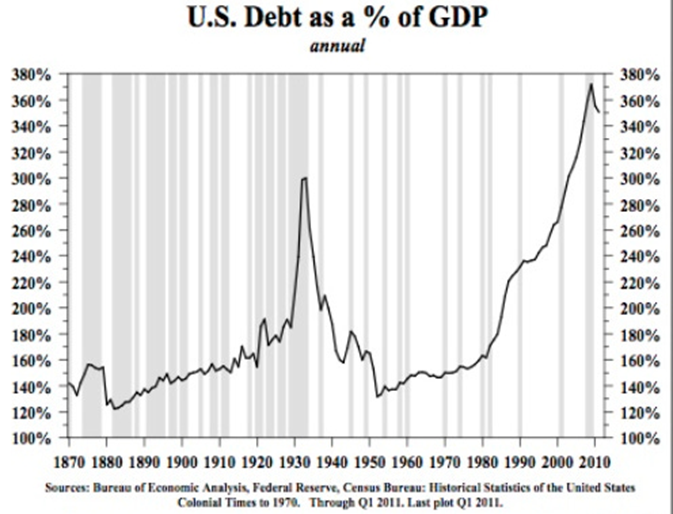
The second reason is debt. In the 1970’s Nixon had just killed off the gold standard, and we didn’t have anywhere near the amount of debt that we have today. The federal debt in 1970 was just $380 billion. Today, of course, it’s over $33 trillion. Almost 100 times larger.
That means 19% rates would utterly destroy public finances. To give a sense, paying 19% on $33.7T in debt would be $6.5 trillion in debt service alone. On top of the deficits we already have, that would mean roughly $8 trillion in annual deficit — 40% of everything the American public earns in debt alone. There’d be nothing left to eat.

Meanwhile, similar levels of debt have built in the financial system, with private debt up roughly 50 times since the 1970’s. Business debt alone is up 40-fold. That means a 1970’s stagflation, even if it only lasts 5 years, would likely launch at least a 2008-style financial crash that would complicate things for a Fed whose response to every financial crisis is to pump up the money printing.
Conclusion
Of course, I could be wrong that we’re repeating the 70’s.
Perhaps because the pandemic lockdowns wiped out enough businesses that we’ve cleared the deadwood and will skip the next recession. Or perhaps because the Fed selling off government bonds — “Quantitative Tightening” — does the job.
Still, history says expect the worst. Because in 110 years the Federal Reserve has never brought down inflation at this pace without a deep recession.
And when that recession hits, 110 years of Federal Reserve says they’ll respond exactly exactly how they did in 1975: With rate cuts that launch a second stagflation.
Could it be even worse? Sure, if the Biden administration keeps coming up with ideas so stupid they approach the catastrophic 1930’s Hoover-FDR agenda that turned a boring stock market correction into the Greatest Depression in a century.
Still, the 1970's with a financial crisis is my base case. In which case a prudent investor would keep a bias towards hard assets — real estate, precious metals, and Bitcoin if you’ve got the risk appetite. All paired with a prudent spending and earning profile.
To receive free commentary and analysis on the gold and silver markets, click here to be added to the Money Metals news service.
Author

Peter St. Onge, PhD
Money Metals Exchange
Peter St. Onge writes articles about Economics and Freedom. He's an economist at the Heritage Foundation, a Fellow at the Mises Institute, and a former professor at Taiwan’s Feng Chia University. His website is www.ProfStOnge.com.


