Relationship between Crude Oil and Oil Stocks

Although verification of the last week breakdown under important resistance line pushed black gold under $56, oil bulls didn’t give up and triggered a pullback. What does it mean for light crude? Will the relationship between crude oil and oil stocks give us more clues about future moves?
Crude Oil’s Technical Picture
Before we try to answer these questions, let’s examine the technical picture of crude oil.
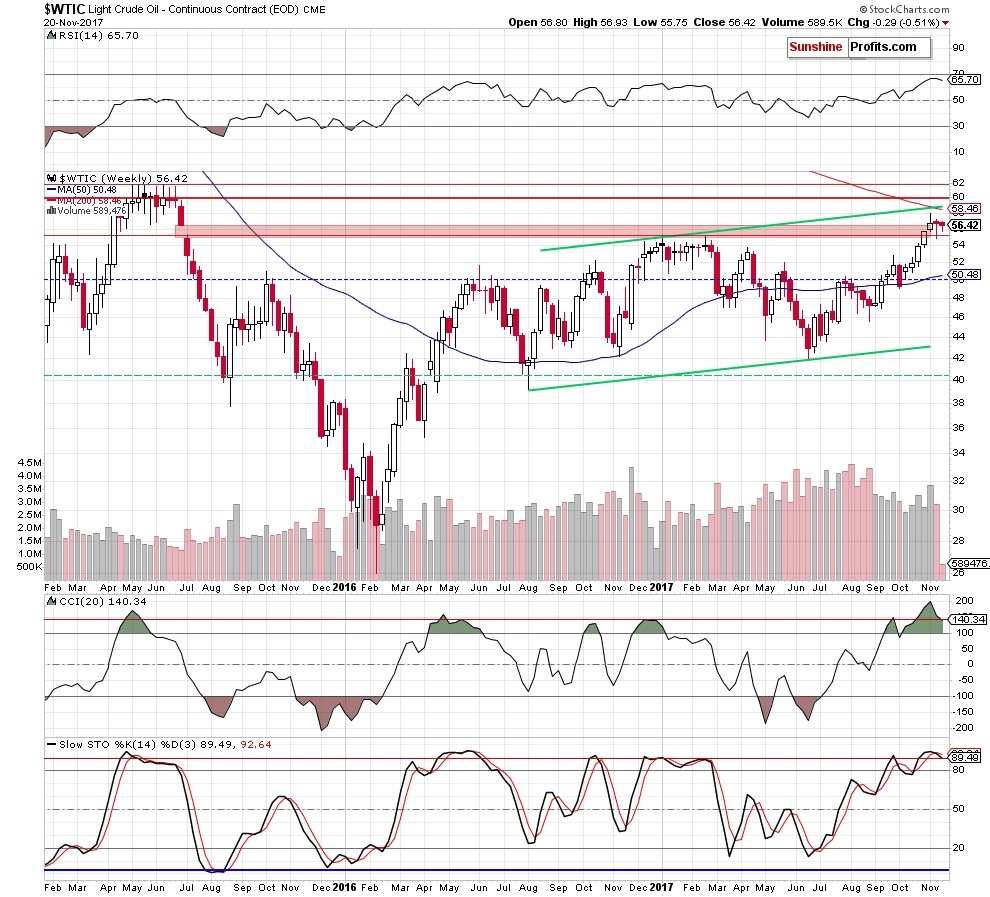
Looking at the weekly chart, we see that the overall situation in the medium term hasn’t changed much as crude oil is still trading in a narrow range around the upper border of the red gap created in 2015. Nevertheless, the current position of the indicators (the sell signal generated by the Stochastic Oscillator and one of the highest readings of the RSI and the CCI since the beginning of the year) continues to favor oil bears.
Having said the above, let’s examine the very short-term chart and find out what we can infer from it.
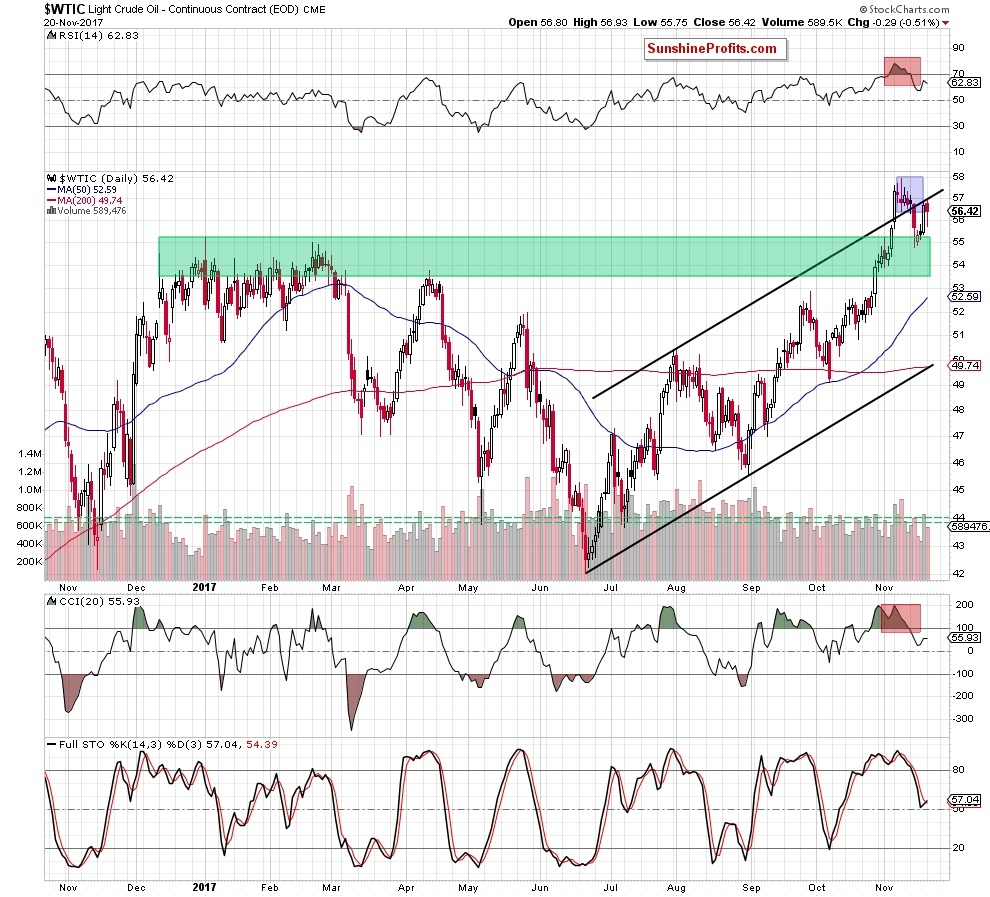
From the daily perspective, we see that Friday’s verification of the earlier breakdown under the upper border of the black rising trend channel encouraged oil bears to act yesterday. Although their opponents tried to push the commodity higher after the market’s open, they failed, which resulted in a drop below $56.
Despite this deterioration, the proximity to the green support zone attracted oil bulls and triggered a rebound – quite similar to what we already saw on Tuesday. Nevertheless, yesterday’s move wasn’t enough to push the price of light crude above the black resistance line, which means that as long as there is no invalidation of the breakdown below it, lower values of black gold are more likely than not – especially when we factor in the situation in the oil-to-gold and oil-to-stock market ratios (we wrote more about them on Wednesday and Friday).
Continuing to examine the relationship between crude oil and other elements of the market, we decided to take a closer look at the oil-to-oil stocks ratio.
Crude Oil – Oil Stocks Link
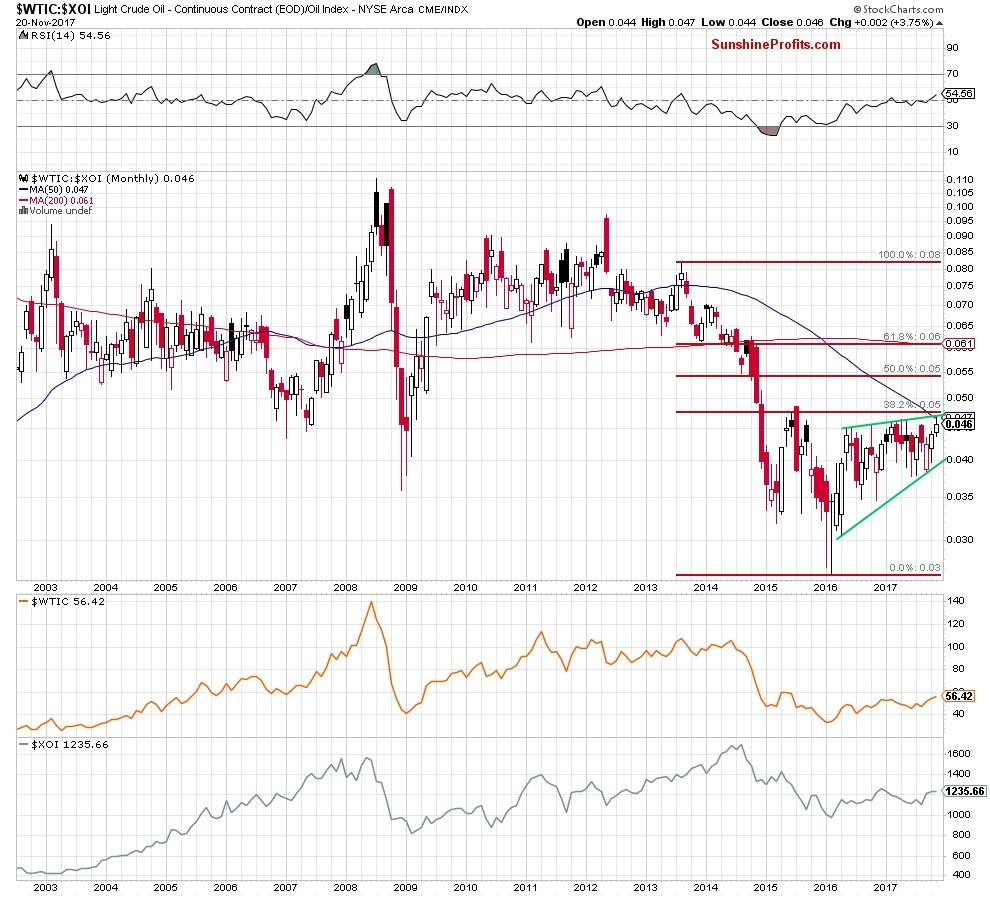
Looking at the long-term chart, we see that although the ratio extended gains in November, it is still trading under a very important resistance zone created by the upper border of the green rising wedge, the 50-week moving average and the 38.2% Fibonacci retracement.
This area is also reinforced by the red gap marked on the weekly chart below.
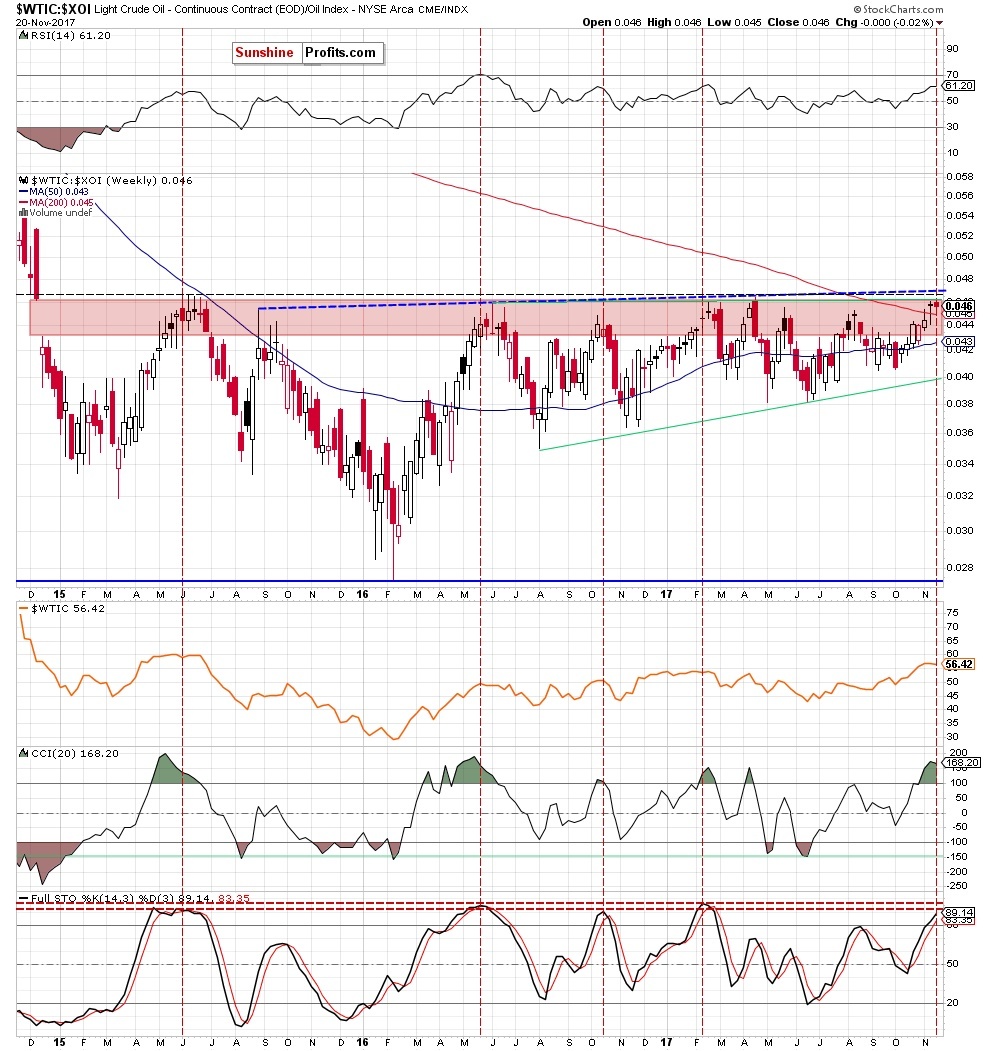
As you see on the above chart, the red gap continues to keep gains in check since 2015. Although the bulls pushed the ratio to this area many times in the past, all their attempts to go north failed, which translated into declines in the following weeks. We saw such price action in June, August 2015, in May, June, October 2016, in February, March, April, May and August 2017.
What happened with crude oil at the same time? In all the above-mentioned cases we noticed declines in light crude, which confirms that there is a positive correlation between the ratio and black gold (similarly to what we wrote in the case of the oil-to-gold and oil-to-stocks ratios). Therefore, in our opinion, if the oil-to-oil stocks ratio reverses and declines in the very near future, we will also see lower prices of crude oil in the following days.
Want free follow-ups to the above article and details not available to 99%+ investors? Sign up to our free newsletter today!
Author

Nadia Simmons
Sunshine Profits


