Rate Hike Cycles vs. the US Dollar: Rate Hikes Bad for Gold?

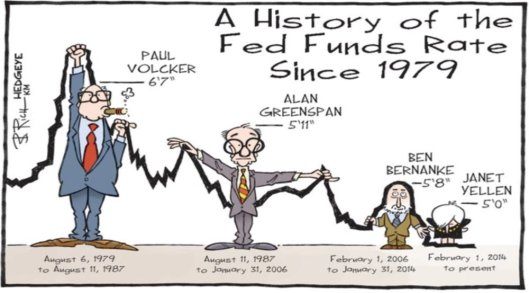
Here are two different looks at Fed rate hikes since Volcker. The charts are the same, but one presentation is a lot funnier than the other.
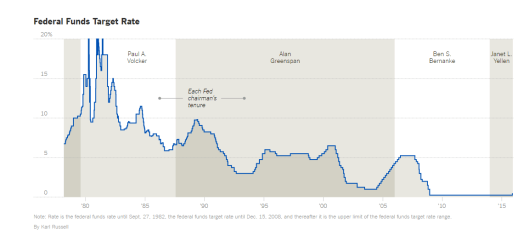
the above image from the New York Times article A History of Fed Leaders and Interest Rates.
Let’s take the fist chart and see what correlations exist between rate hikes and the US dollar index.
Rate Hike Cycle vs. the US Dollar
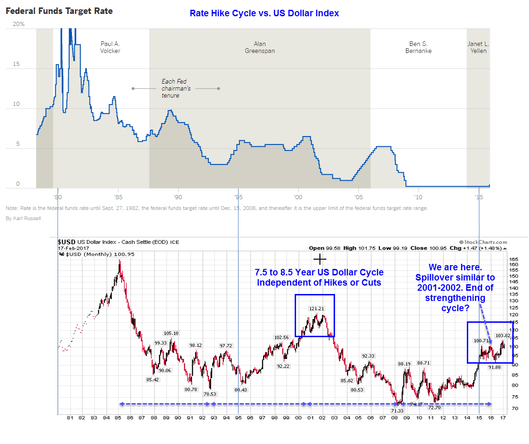
Conventional wisdom suggests rate hikes will support the US dollar.
US Dollar Conventional Wisdom vs. Rate Hike Reality
-
Currency trends seem to linger in both directions at the end of the rate hike and rate cutting episodes.
-
Dollar cycles have run about 7.5-8.5 years. If the pattern hold, this latest strengthening may soon be over, if it’s not over already.
-
The dollar peaked in February of 1985, long after the Fed stopped hiking.
-
The Dollar fell in 1984, just as Fed embarked on 17 consecutive hikes. The dollar then continued its decline for several more years after the Fed paused. At that time, hyperinflationists came out of the woodwork, predicting a dollar collapse. Three years later the dollar tested the low then blasted higher well before the Fed started to hike.
British Pound 8-Year Cycle
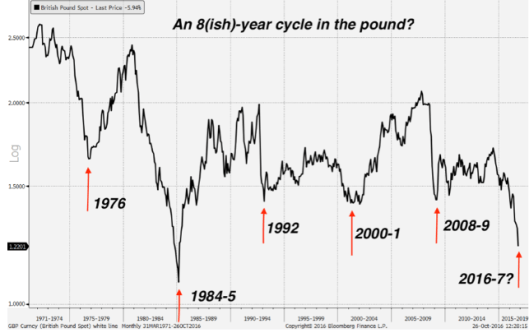
The above chart from You’ve heard of Kondratiev waves – now meet the Frisby flux, the pound’s eight-year cycle by Dominic Frisby.
Rate Hikes Bad for Gold?
Conventional wisdom also says rates hikes are bad for gold. Let’s take a look.
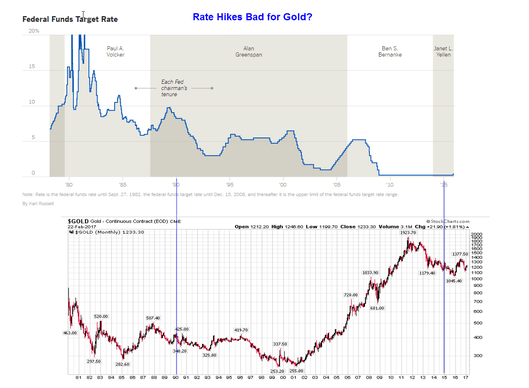
How’s that conventional wisdom doing?
Why is it that nearly all of mainstream media preaches that rates hikes will strengthen the dollar and rate hikes will be bad for gold?
Gold Does Well in These Environments
1. Deflation
2. Hyperinflation
3. Stagflation
4. Decreasing faith that central banks have everything under control.
5. Rising credit stress and fear of defaults
Gold Does Poorly in These Environments
1. Disinflation (1980 to 2000 is a perfect example. There was inflation every step of the way but gold got clobbered).
2. Increasing faith in central banks’ ability to keep things under control (Mario Draghi’s “Whatever it takes” speech triggered a prime example)
Gold does worst in periods of prolonged disinflation and in periods of rising faith in central banks.
Moments in Gold History
-
On August 15th, 1971 Nixon closed the gold redemption window. Gold was $43.15 an ounce. Stagflation ensued. Gold soared.
-
On January 21, 1980, gold closed at $850 an ounce. That was the market top for decades.
-
US inflation peaked at 14.8 percent in March 1980. The Federal Reserve board led by Paul Volcker raised the federal funds rate, which had averaged 11.2% in 1979, to a peak of 20% in June 1981. It was not the rate hikes directly that led to the plunge in gold. Rather, the rates hikes convinced the public and the markets that the Fed had everything under control.
-
On May 7, 1999, the Bank of England announced plans to dump its gold for other assets. The price of gold was at US$282.40 per ounce. The advance notice of the substantial sales drove the price of gold down by 10% by the time of the first auction on 6 July 1999. With many gold traders shorting, gold reached a low point of US$252.80 on 20 July. This is frequently called “Brown’s Bottom” after Gordon Brown, then the UK Chancellor of the Exchequer.
-
Between 2000 and 2006 gold soared in conjunction with a massive housing bubble as the Greenspan Fed hiked 17 consecutive meeting at “pace that is likely to be measured”. The Housing bubble burst in 2007.
-
On April 17, 2008, gold touched $956.20, then collapsed along with everything else in the great recession.
-
On November 13, 2008, gold touched $698.20. That local bottom has not been approached since.
-
On August 23, 2011, Gold peaked at $1923.70 with a European Debt Crisis underway and the Fed involved in a series of QE actions.
-
On July 26, 2012, Mario Draghi made his famous “Whatever It Takes” Speech. “Within our mandate, the ECB is ready to do whatever it takes to preserve the euro. And believe me, it will be enough.” Gold closed at $1614.
-
On September 6, 2012, in a further attempt to calm the European Debt Crisis, the ECB announced free unlimited support for all eurozone countries involved in a sovereign state bailout/precautionary program from EFSF/ESM, through some yield-lowering Outright Monetary Transactions (OMT).
-
On December 17, 2015 gold touched $1046.80. At that time, numerous people emailed that gold would fall to $800, then $600. Some suggested it would fall all the way back to $250.
-
Once again writers want you to dump your gold because of the dollar and rate hikes.
Conventional Wisdom Roundup
Gold does not necessarily rise and fall with interest rates, jewelry demand in India, or any other widely believed nonsense. Rather, gold has moved in conjunction with perceptions as to whether or not the Fed and central banks have everything under control.
If you think everything is under control, and do not want insurance against a currency crisis or another debt crisis, then dump your gold.
If you believe as I do, that everything is not under control, or if you want some insurance, then take a position in gold.
Either way, stop listening to conventional wisdom regarding gold. The charts show how laughable that wisdom is.
Author

Mike “Mish” Shedlock's
Sitka Pacific Capital Management,Llc
Mike “Mish” Shedlock is a registered investment advisor for SitkaPacific Capital Management.


