|

QE or Not, the S&P 500 Has Consistently Rallied Since Fed Repo Operations Began

If that date doesn’t ring a bell for you, you’re not alone…but it’s been arguably one of the most important days for US stock markets over the past few months.

On that date, the Federal Reserve announced that it would be conducting a series of “purely technical” repurchase agreements “to ensure that reserves remain ample” in the financial system. These twice- or thrice-weekly $35B+ injections of liquidity have continued since in a process that traders have sarcastically dubbed “Not Quantitative Easing.” Over this period, the Fed’s balance sheet has grown by nearly $4T, unwinding about half of the “Quantitative Tightening” decrease since the start of 2018:
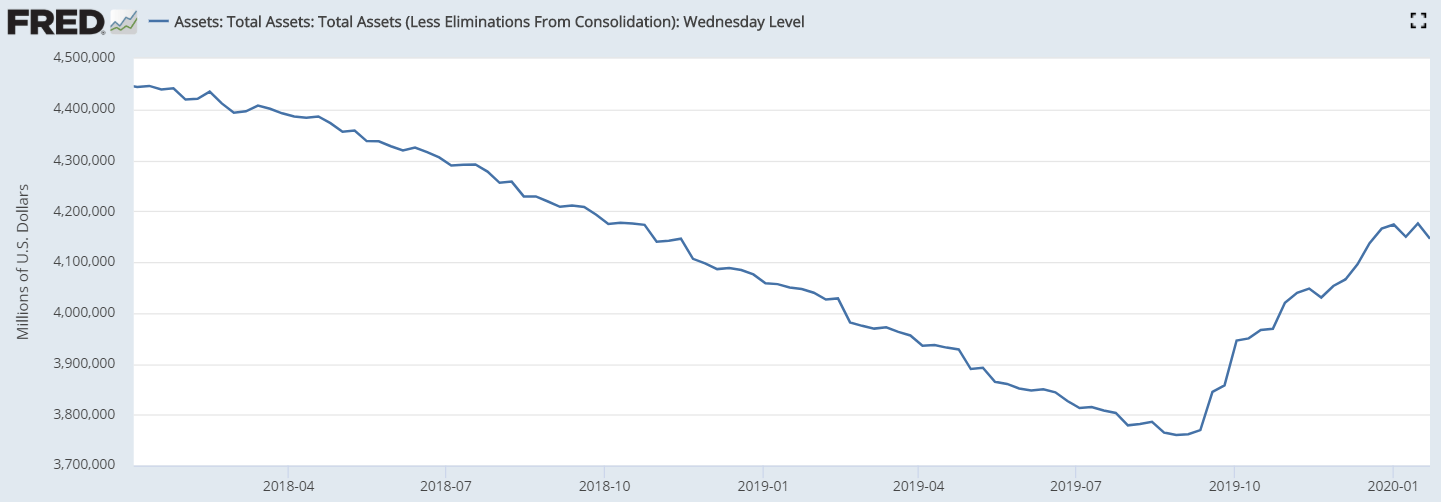
Source: Federal Reserve, FRED

Repo operations like these are a standard tool that central banks use to manage liquidity in financial systems around the globe, but there’s no denying that we’ve seen an astoundingly consistent rally in the S&P 500 since the Fed’s announcement. As the chart below shows, the S&P 500 has closed below even its short-term 10-day moving average just five times in the 70-plus trading days since the Fed’s repo operations began:
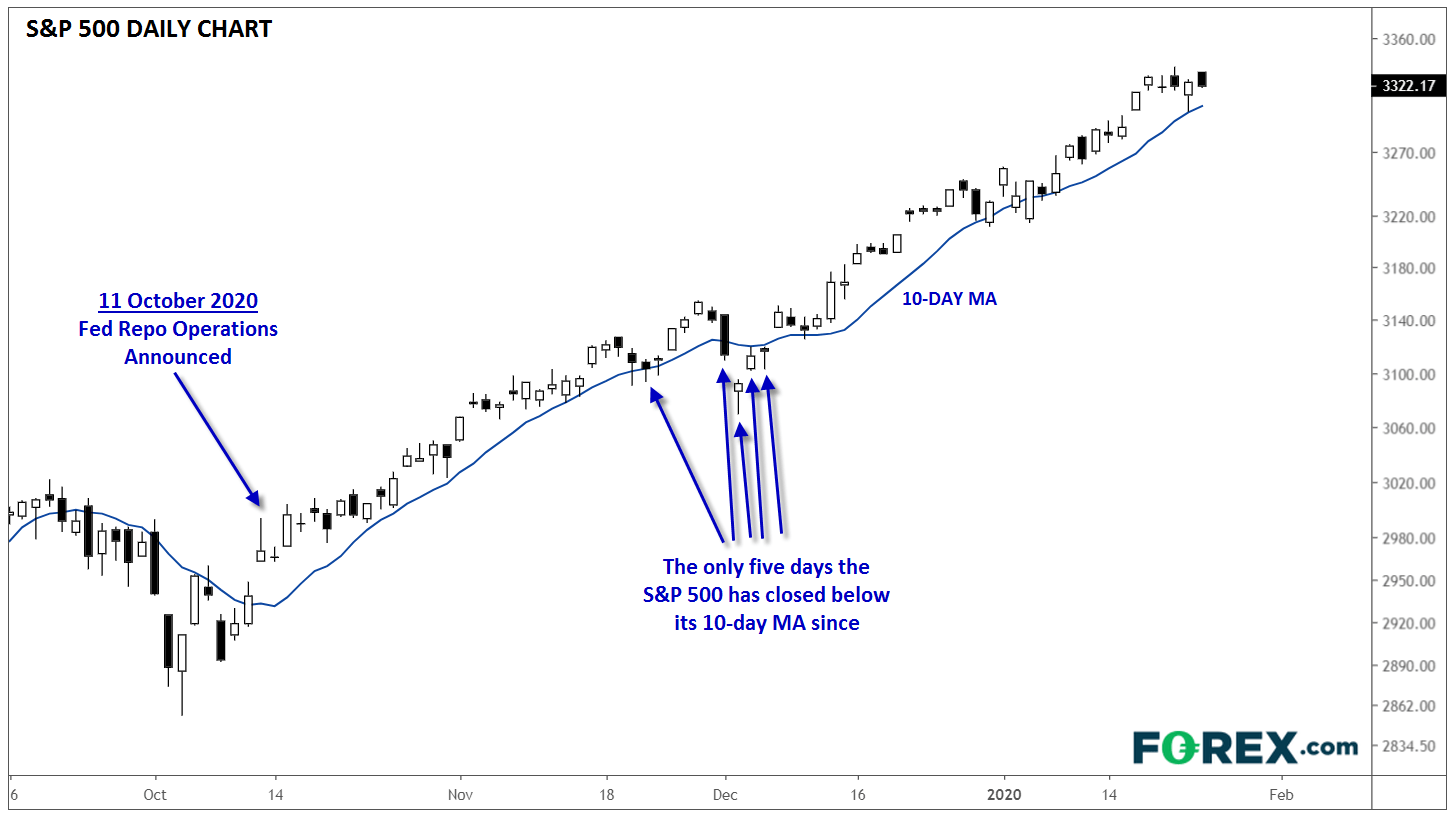
SP500

Source: TradingView, Gain Capital

According to Quantitative Edges, this is the fewest times that the S&P 500 has closed below its 10-day MA over a 70-day period since 1972, nearly 50 years ago! By this measure, US stocks haven’t seen this consistent of a rally since most of us have been alive.

Of course, as any Statistics 101 student will tell you, correlation does not necessarily indicate causation, but given the remarkably reliable rally we’ve seen, US index traders should definitely be paying close attention to any changes in the Fed’s “Not QE” schedule of repo purchases.

Author

Matt Weller, CFA, CMT

Matt Weller, CFA, CMT

Faraday Research

Matthew is a former Senior Market Analyst at Forex.com whose research is regularly quoted in The Wall Street Journal, Bloomberg and Reuters. Based in the US, Matthew provides live trading recommendations during US market hours, c


More from Matt Weller, CFA, CMT
Share:

Editor's Picks

GBP/USD bounces off four-day lows, still below 1.3500

GBP/USD sticks to the bearish tone on Thursday, coming down to the 1.3480 region in the latter part of the NA session. In the meantime, Cable’s weakness comes as investors continue to assess mixed UK data, poor US results, and the persistent uncertainty surrounding the US-Iran conflict.

EUR/USD looks apathetic around 1.1530

EUR/USD reverses Wednesday’s downtick and trades with modest gains in the 1.1530 region following the end of the NA session on Thursday. The pair’s tepid advance comes on the back of the absence of clear direction in the US Dollar despite tensions from the Middle East appear far from alleviated. Later on Friday, investors are expected to monitor the the releases of another revision of GDP figures in the Euroland, US Retail Sales and the preliminary U-Mich gauge.

Gold loses the grip, recedes toward $4,350

Gold extends its intraday pullback on Thursday, retesting the $4,350 zone per troy ounce, or three-day troughs. Meanwhile, the yellow metal continues to monitor developments from the Middle East as well as bets surrounding the potential Fed’s rate path.

Ethereum Price Forecast: Fidelity plans to add staking to ETH ETF amid yield debate
Asset manager Fidelity has filed with the US Securities and Exchange Commission (SEC) to permit staking in its Ethereum (ETH) exchange-traded fund (ETF), the Fidelity Ethereum Fund (FETH), which holds over $898 million in net assets.
Week ahead – Summer lull could be tested by geopolitics and central bank expectations

US dollar stabilizes as September Fed hike bets remain subdued. Market volatility stays low, but thin liquidity could amplify movements. Key UK data could challenge pound strength; euro craves bullish catalysts.

Why is Crude Oil priced for a reopening the ships haven't made?
Fourteen vessels crossed the Strait of Hormuz on Tuesday. Before the war, the count ran near 120 a day. In the sessions since the waterway was publicly declared open, Brent has drifted back to $87 and West Texas Intermediate (WTI) to $81, both a little lower again on Wednesday, with daily momentum on each unwound from the top of its range in late July to the low twenties now.