Prospect of a second Brexit referendum stokes sterling volatility

Market Overview
After weeks of political procrastination since the deadline extension to Article 50, finally something substantial to go on for Brexit. Beleaguered Prime Minister May will try for a fourth and final time to get her Withdrawal Agreement Bill (WAB) through Parliament. Nothing much has changed from the other three times, aside from the odd tweak here and there on a customs union in the political declaration (which is not legally binding). However the big difference is with the potential add-ons. Mrs May has promised a vote in Parliament on whether to have a second referendum attached to her deal. In a massively divided House of Commons, this is an incendiary decision. But wait, will this all be happening at all? In an attempt to finally drag this over the line, Mrs May could bring about her downfall even sooner and risk total failure. Backbench Conservative MPs will meet to decide on whether to change the rules on a leadership challenge. This could be quick and trigger a change of Prime Minister that would kill off the fourth vote on the WAB. This is the crucial element that could lead to sharper sterling weakness, amidst the prospect of a new euro-sceptic Conservative Prime Minister. Traction could be swift suddenly and the next few days crucial for Brexit. Markets do not know what to make of all this. Sterling spiked over 100 pips up only to quickly unwind the move in a volatile session. Weighing up the Brexit permutations is as difficult a task as ever today. However, the wild ride on Brexit may have been cranked up once more.
Wall Street rallied last night with the S&P 500 +0.8% at 2864 but ongoing conflicting newsflow on the trade dispute mean traders are unsure. US futures have unwound back by around +0.3% this morning. This uncertainty is leading to mixed moves on Asian markets with the Nikkei +0.1% and Shanghai Composite -0.6%. In forex, the trend of USD strength is edging higher once more, but with a mild negative bias which is helping JPY to outperform. In commodities, a stronger dollar is again a drag on gold, whilst oil is pressured following the surprise build in the API inventories.
The big focus on the economic calendar for the European morning comes with UK inflation for April at 0930BST. Consensus expects UK headline CPI to increase to +2.2% (from +1.9% in March), with UK core CPI expected to tick higher to +1.9% (from +1.8% in March). The EIA oil inventories at 1530BST are expected to show crude stocks in drawdown by -2.5m barrels (+5.4m last week) with distillates drawing down by -0.3m barrels (-1.1m last week) and gasoline stocks in drawdown by -1.5m barrels (-1.1m last week). The FOMC minutes for the May meeting are at 1900BST and the focus will be on how the committee as a whole viewed the recent deterioration in inflation.
The Fed speakers this week keep rolling in. Today we have the FOMC’s John Williams (voter, leans hawkish) at 1500BST.
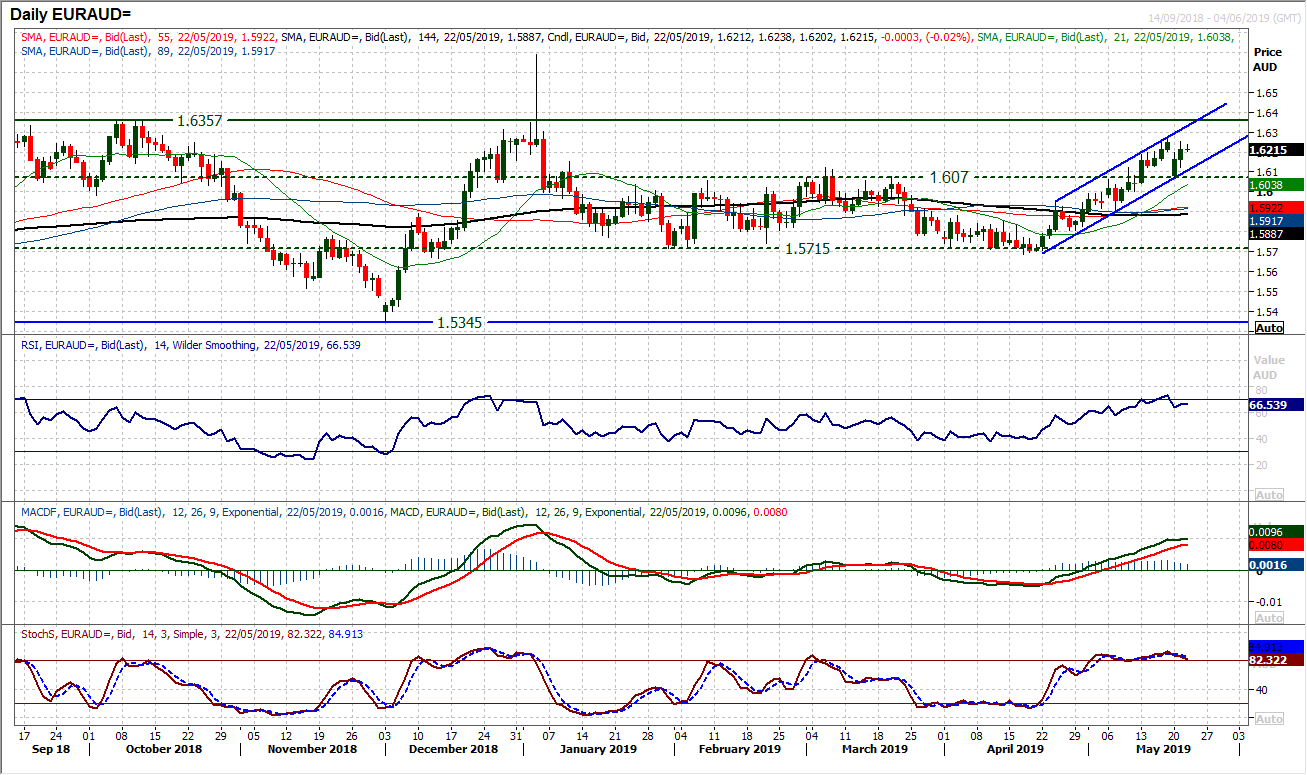
Chart of the Day – EUR/AUD
The uptrend channel of the past four weeks continues to pull the market higher. Monday’s sharp open of Aussie strength in the wake of Sunday’s election did not last long and EUR/AUD has subsequently formed two solid bull candles. The fact that this has come as the market pulled back to find support around an old pivot band at 1.6070 just increases the near term bullish outlook. Momentum indicators are positively configured and suggest buying into near term weakness. The channel support is at 1.6100 today providing a basis of support now. The market is well set up now to breakout above last week’s high of 1.6260 whilst the key September/October 2018 highs at 1.6355 in due course. The hourly chart shows initial support in the band 1.6175/1.6200.
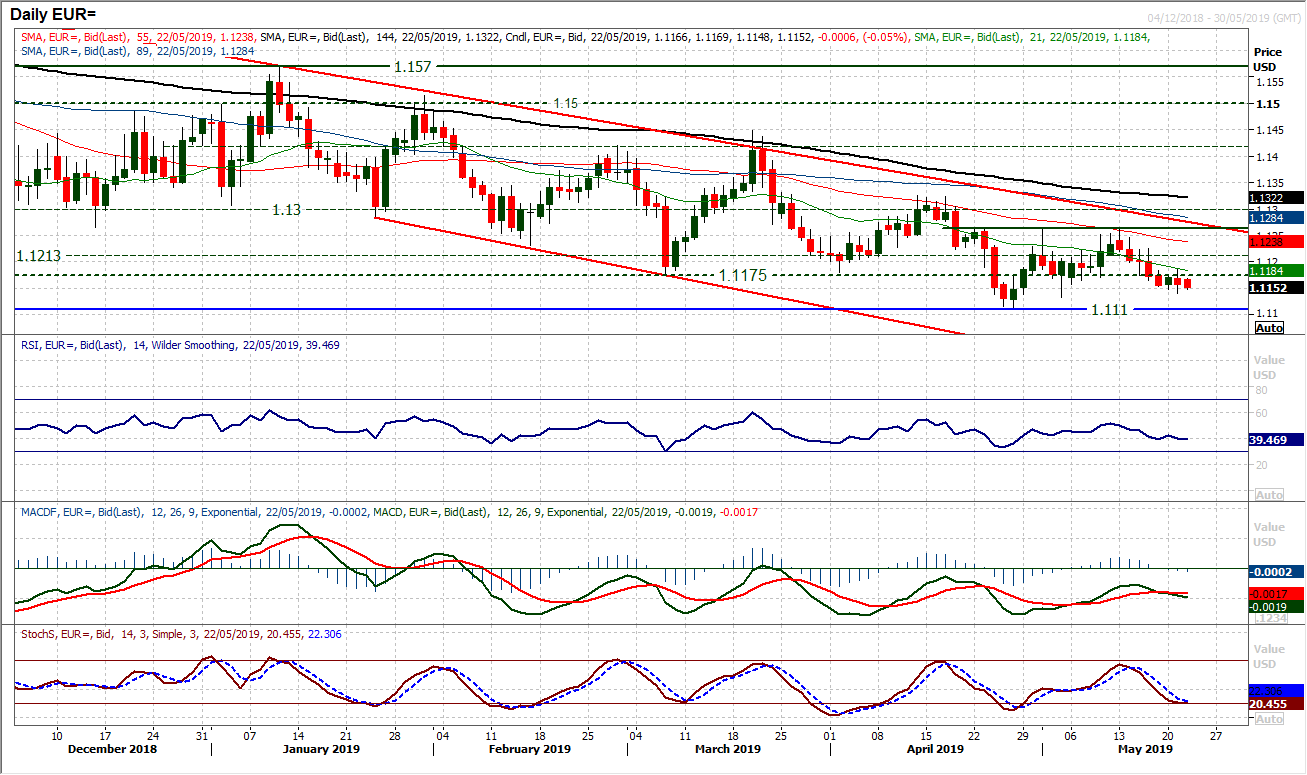
EUR/USD
The euro remains stuck under the old floor at $1.1175 and technical signals continue to point to further weakness. Although the selling pressure has been less decisive in recent sessions, this is still a market selling into strength. Initial support at $1.1135/$1.1140 is protecting the $1.1110 key April low. However, given the medium term negative configuration on momentum indicators this key low is set to be tested. Failing around 50 recently, the RSI has fallen to around 40, with further downside potential. The MACD lines are also crossing lower. The hourly chart shows a resistance band $1.1175/$1.1185 now whilst hourly momentum is set to sell into strength. Recoveries fail around 60 on hourly RSI and the hourly MACD lines are again crossing lower around neutral. A previous pivot at $1.1220 provides further resistance overhead. Below $1.1110 opens $1.1000.
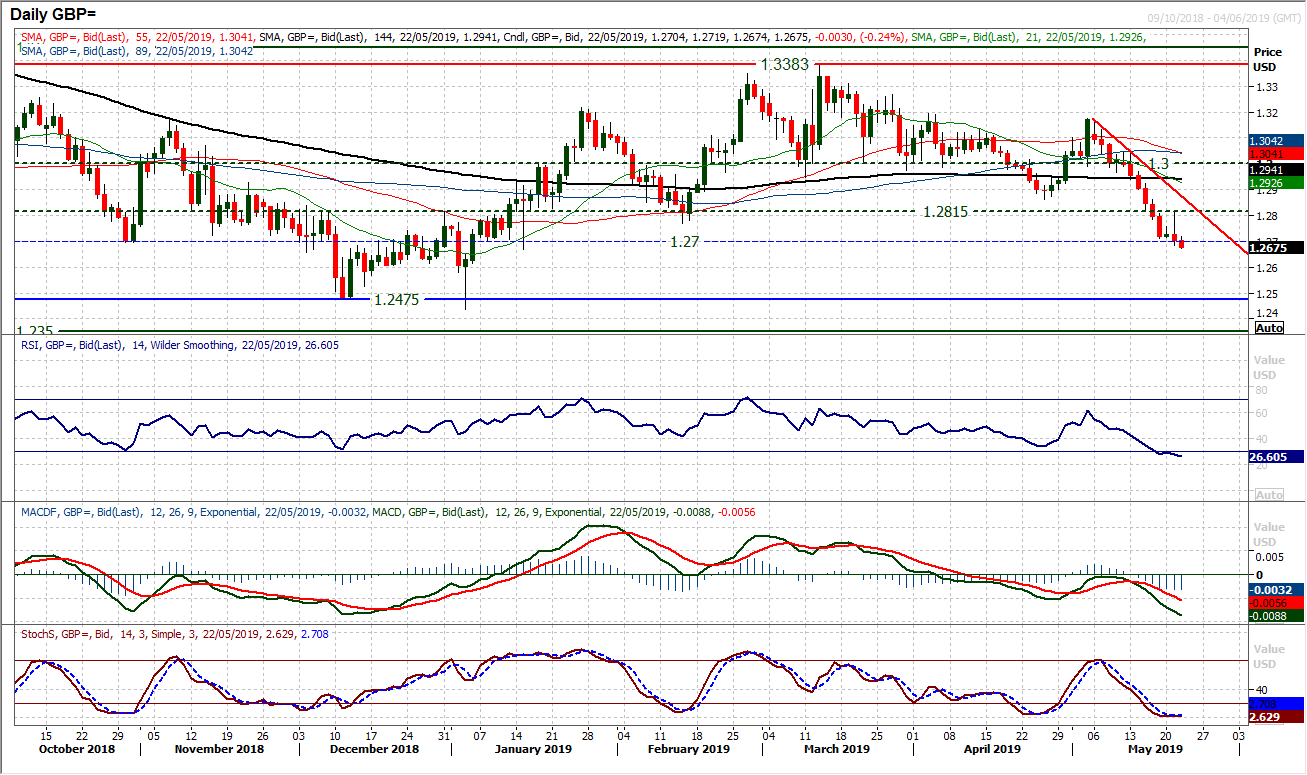
GBP/USD
Brexit newsflow returns to spike volatility on sterling. A quick intraday round trip to $1.2815 has left resistance and a lower high at an old pivot level that had looked defunct. Formation of a rather negative looking candlestick also does not bode well for sterling. As the dust settles, taking a step back there is an argument to say that little has changed technically on Cable, yesterday’s volatility aside. The market closed marginally lower and seems set to continue to sell into strength today to leave resistance at $1.2720. The RSI remains stuck under 30, Stochastics negatively configured and MACD lines in decline. For now though the market is still falling away. Technically, the support around the $1.2700 is breaking and a clear closing breach of $1.2700 would open downside towards $1.2475. It would be an indication that the market is increasingly negative on the prospect of a Brexit deal. However, what is for sure is that focus on Brexit developments is once more key. The permutations of outcomes that Brexit could now produce will leave sterling traders nervous of blindly positioning short. Stay close to the UK political news flow.
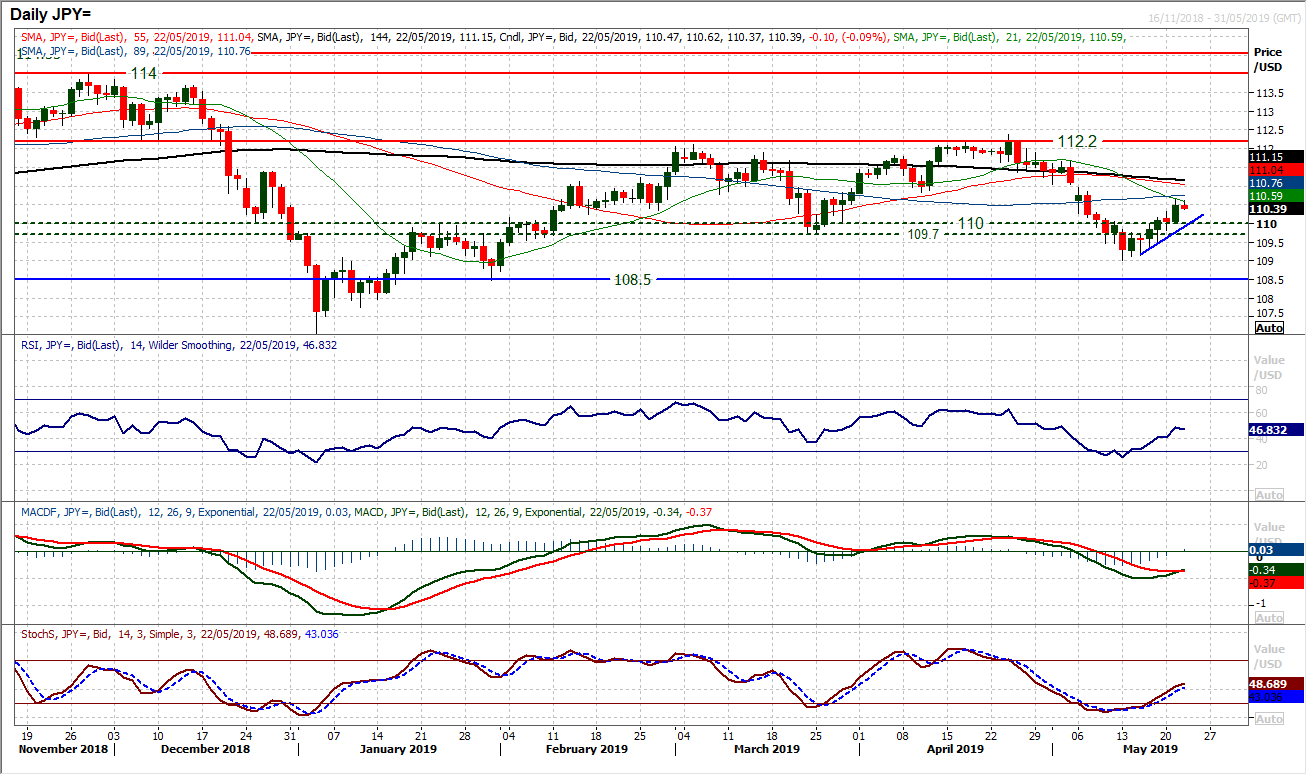
USD/JPY
We discussed previously the improving outlook on Dollar/Yen and an acceleration higher in yesterday’s session took that move on board. A move decisively clear of the pivot band 109.70/110.00 builds an improving outlook now. This comes with building a one week uptrend which is supportive at 109.90 today. It is backed by improvements in the momentum indicators with a bull cross forming on MACD as RSI and Stochastics pull higher. Weakness is a chance to buy now. The run of higher daily lows is now six sessions long, with yesterday’s low at 110.00 now a gauge to watch. The hourly chart momentum indicators are classically set up for continued recovery and buying into weakness. Hourly RSI consistently above 40 and MACD lines consistently above neutral is positive. A near term pivot at 110.25 is initially supportive. Back above yesterday’s high at 110.67 opens 110.95/111.00.
Gold
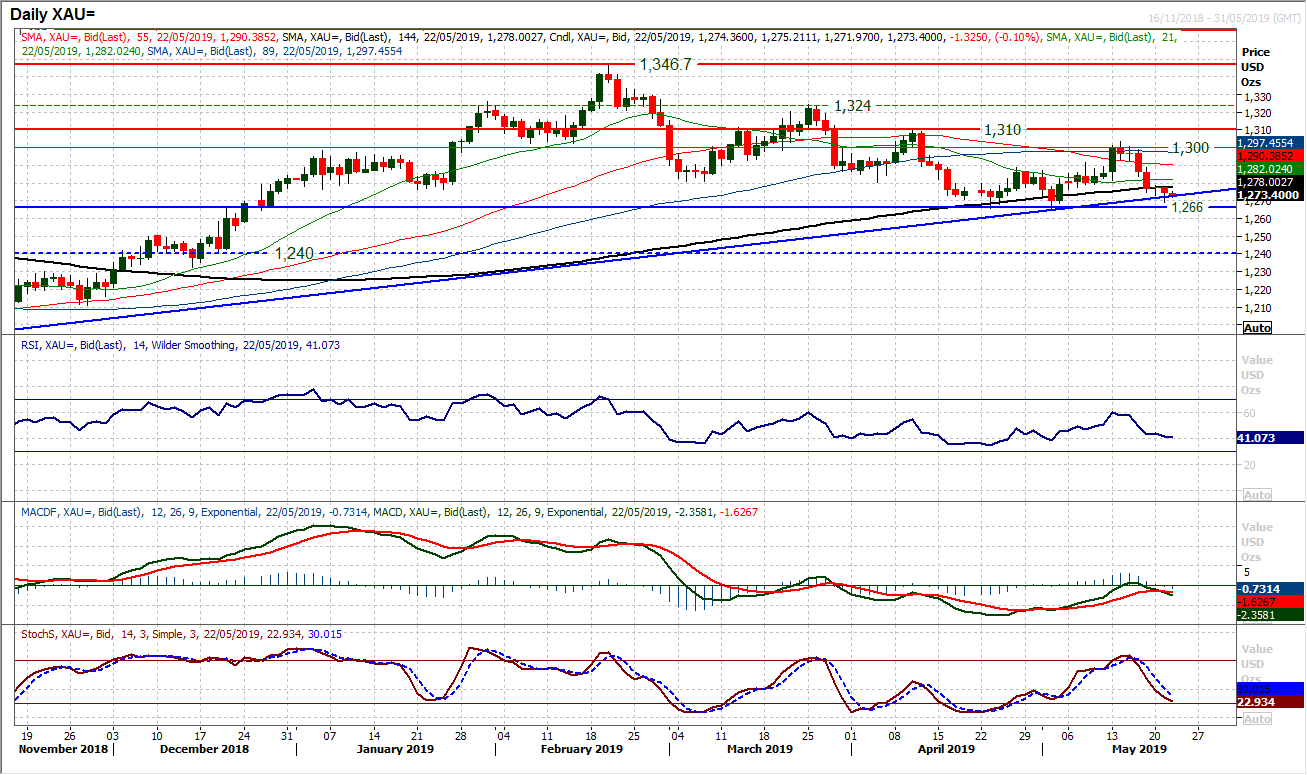
The gold buyers are teetering on the brink of losing the final reasons to be bullish. Yesterday’s intraday breach of the nine month uptrend (today at $1273) may not have lasted into the close, but the warnings signs are there. A closing breach of the trend and then losing key support at $1266 would be the final straw. Momentum is reflecting the mounting downside pressure but which also shows further downside potential. The RSI is falling around 40, whilst MACD lines are crossing lower under neutral and Stochastics continue to accelerate lower. The hourly chart shows that the old pivot at $1278 is bolstered as a basis of resistance now and the negative configuration on hourly MACD and RSI show intraday rallies are a chance to sell. A closing breach of $1266 would open the downside for initial support at $1250 and then an old pivot around $1240.
WTI Oil
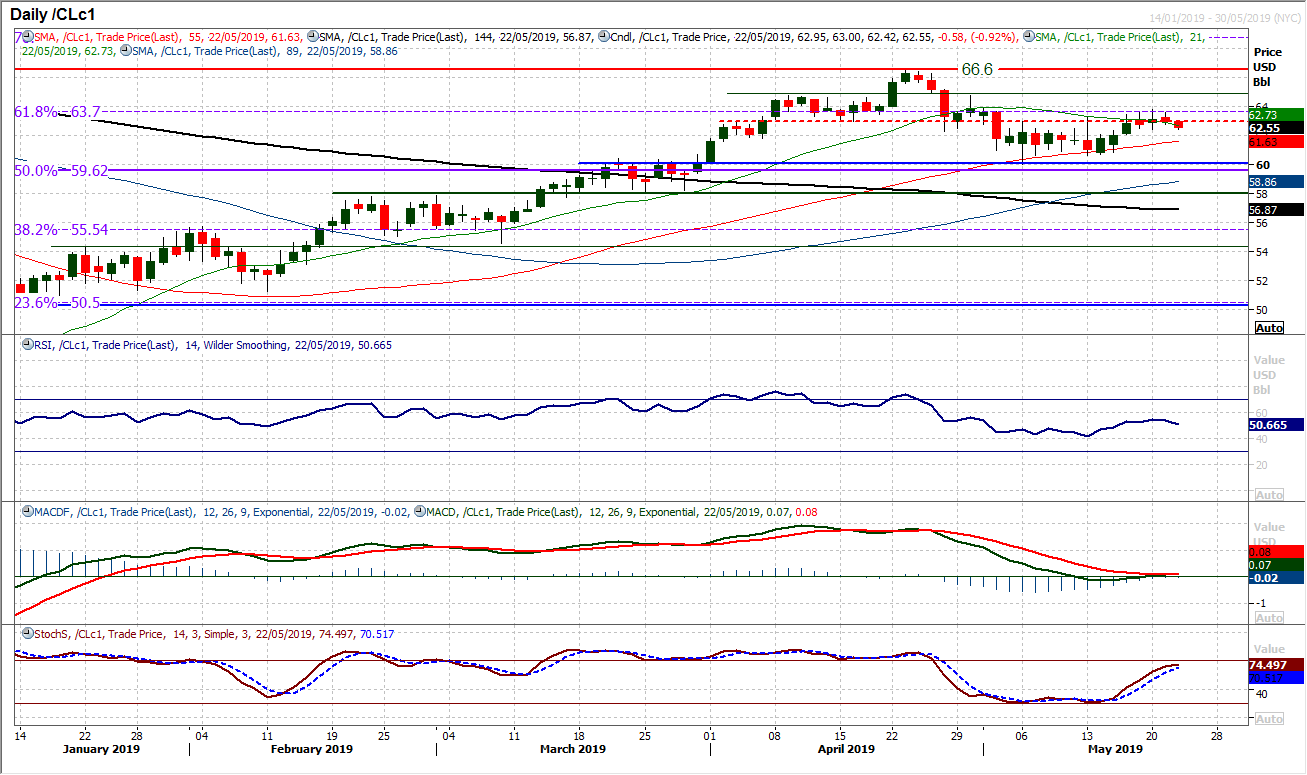
With the shackles still on for the bulls, after losing momentum in the recovery, the positive bias is now being questioned. The market has never really been able to decisively pull clear of resistance around $63.00. Now, a series of highly indecisive candles is beginning to pull on the market. Is the market rolling over? How the bulls respond at the near term support of $62.50 could be key now. A move below $62.50 on a consistent basis would build negative momentum. This is already threatening on the hourly chart with hourly RSI holding under 40, MACD lines and Stochastics their lowest in a week. Losing support at $62.50 opens the next band $60.00/$61.00 again.
Dow Jones Industrial Average
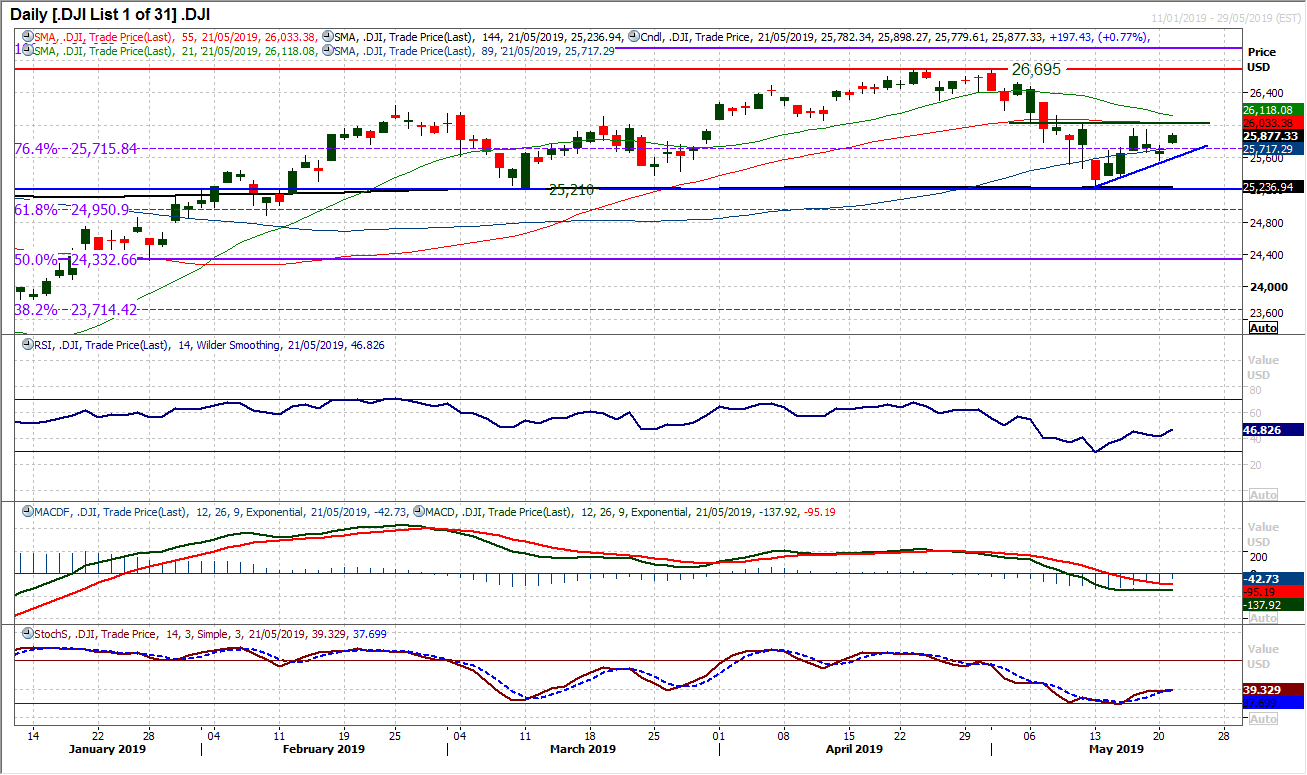
With last week’s recovery slipping a gear, the question of whether there is a large top formation in process has arisen. However, the bulls will go some way towards avoiding this prospect if they can find a recovery back above resistance at 26,020. Yesterday’s positive session has re-opened the recovery. The RSI has ticked back higher and the market is now seemingly setting up to leave 25,560 as a higher low. The importance of 26,020 is high on the near term perspective. It is the first lower high to overcome, but given last week’s resistance at 25,958, a move above 26,020 would also constitute a small base pattern reversal too (a two week base). If the hourly chart can build on yesterday’s positive session with hourly RSI pushing into the 70s and MACD lines decisively above neutral, the bulls will be looking far better positioned. Above 26,020 resistance is 26,120/26,180.
Author

Richard Perry
Independent Analyst


