Press conference overshadows markets [Video]
![Press conference overshadows markets [Video]](https://editorial.fxstreet.com/images/Markets/Equities/Industries/Utilities/pexels-pixabay-257700-637435399652652113_XtraLarge.jpg)
US Dollar: Mar '22 USD is Up at 95.550.
Energies: Mar '22 Crude is Down at 85.70.
Financials: The Mar '22 30 Year bond is Down 5 ticks and trading at 154.13.
Indices: The Mar '22 S&P 500 emini ES contract is 80 ticks Higher and trading at 4544.25.
Gold: The Feb'22 Gold contract is trading Down at 1839.00. Gold is 42 ticks Lower than its close.
Initial conclusion
This is not a correlated market. The dollar is Up, and Crude is Down which is normal, but the 30-year Bond is trading Lower. The Financials should always correlate with the US dollar such that if the dollar is lower, then the bonds should follow and vice-versa. The S&P is Higher, and Crude is trading Lower which is correlated. Gold is trading Lower which is correlated with the US dollar trading Up. I tend to believe that Gold has an inverse relationship with the US Dollar as when the US Dollar is down, Gold tends to rise in value and vice-versa. Think of it as a seesaw, when one is up the other should be down. I point this out to you to make you aware that when we don't have a correlated market, it means something is wrong. As traders you need to be aware of this and proceed with your eyes wide open. Currently Asia is trading mainly Higher with the exception of the Shanghai and Sensex exchanges which are Lower. Currently all of Europe is trading Lower with the exception of the Milan exchange which is Higher.
Possible challenges to traders today
-
Philly Fed Manufacturing Index is out at 8:30 AM EST. This is Major.
-
Unemployment Claims are out at 8:30 AM EST. This is Major.
-
Existing Home Sales is out at 10 AM EST. This is Major.
-
Natural Gas Storage is out at 10:30 AM EST. This is Major.
-
Crude Oil Inventories is out at 11 AM EST. This is Major.
Treasuries
Traders, please note that we've changed the Bond instrument from the 30 year (ZB) to the 10 year (ZN). They work exactly the same.
We've elected to switch gears a bit and show correlation between the 10-year bond (ZN) and the S&P futures contract. The S&P contract is the Standard and Poor's, and the purpose is to show reverse correlation between the two instruments. Remember it's likened to a seesaw, when up goes up the other should go down and vice versa.
Yesterday the ZN made its move at around 10:45 AM EST. The ZN hit a Low around that time and the S&P moved Lower. If you look at the charts below ZN gave a signal at around 10:45 AM EST and the S&P moved Lower at around the same time. Look at the charts below and you'll see a pattern for both assets. ZN hit a Low at around 10:45 AM EST and the S&P was moving Lower shortly thereafter. These charts represent the newest version of MultiCharts and I've changed the timeframe to a 15-minute chart to display better. This represented a Long opportunity on the 10-year note, as a trader you could have netted about 15 ticks per contract on this trade. Each tick is worth $15.625. Please note: the front month for the ZN is now Mar '22. The S&P contract is now Mar '22 as well. I've changed the format to Renko bars such that it may be more apparent and visible.
Charts courtesy of MultiCharts built on an AMP platform
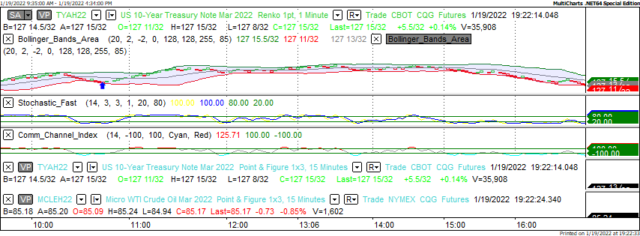
ZN - Mar 2022 - 01/19/22
-637782772797161089.png)
S&P - Mar 2022 - 01/19/22
Bias
Yesterday we gave the markets an Upside bias as both the USD and the Bonds were pointed Lower yesterday morning. This usually reflects and Upside bias, but the markets had other ideas. The Dow dropped 340 points and the other indices lost ground as well. Today we aren't dealing with a correlated market and our bias is to the Upside.
Could this change? Of Course. Remember anything can happen in a volatile market.
Commentary
So yesterday we had an interesting situation in that the markets were correlated to the Upside Wednesday morning. Initially the markets did gain ground as they rose immediately after the Opening Bell. Both the Building Permits and the Housing Starts exceeded expectation. But the looming specter of President Biden's upcoming press conference shadowed the market. The Dow dropped 340 points, the S&P 44 and the Nasdaq 167. Biden's Press Conference frankly wasn't really that good. The President gave the impression that Russia will definitely attack the Ukraine and other comments as well. Will this change today? Only time will tell.
Author

Nick Mastrandrea
Market Tea Leaves


