President-elect Biden has given a blueprint of what he'll do [Video]
![President-elect Biden has given a blueprint of what he'll do [Video]](https://editorial.fxstreet.com/images/Macroeconomics/Events/US Elections/Joe_Biden3-637311959678504319_XtraLarge.jpg)
US Dollar: Dec '20 USD Up at 90.345.
Energies: Jan'21 Crude is Down at 52.87.
Financials: The Mar '21 30 year bond is Up 14 ticks and trading at 168.21.
Indices: The Mar'21 S&P 500 emini ES contract is 45 ticks Lower and trading at 3780.00.
Gold: The Feb'21 Gold contract is trading Up at 1854.10. Gold is 26 ticks Higher than its close.
Initial Conclusion
This is not a correlated market. The dollar is Up+ and Crude is Down- which is normal and the 30 year Bond is trading Higher. The Financials should always correlate with the US dollar such that if the dollar is lower then bonds should follow and vice-versa. The S&P is Lower and Crude is trading Lower which is not correlated. Gold is trading Higher which is not correlated with the US dollar trading Up+. I tend to believe that Gold has an inverse relationship with the US Dollar as when the US Dollar is down, Gold tends to rise in value and vice-versa. Think of it as a seesaw, when one is up the other should be down. I point this out to you to make you aware that when we don't have a correlated market, it means something is wrong. As traders you need to be aware of this and proceed with your eyes wide open.
Asia is trading Mixed with half the exchanges Higher and the other half Lower. Currently Europe is trading Higher with the exception of the Milan exchange which is trading Lower at this time.
Possible Challenges To Traders Today
-
PPI is out at 8:30 AM EST. This is Major.
-
Core PPI is out at 8:30 AM EST. This is Major.
-
Retail Sales is out at 8:30 AM EST. This is Major.
-
Core Retail Sales is out at 8:30 AM EST. This is Major.
-
Empire State Manufacturing Index is out at 8:30 AM EST. Major.
-
Capacity Utilization Rate is out at 9:15 AM EST. Not Major.
-
Industrial Production m/m is out at 9:15 AM EST. Major.
-
Business Inventories m/m is out at 10 AM EST. This is Major.
-
Prelim UoM Consumer Sentiment is out at 10 AM EST. Major.
-
Prelim UoM Inflation Expectations is out at 10 AM EST. Major.
Treasuries
Traders please note that we've changed the Bond instrument from the 30 year (ZB) to the 10 year (ZN). They work exactly the same.
We've elected to switch gears a bit and show correlation between the 10 year bond (ZN) and The S&P futures contract. The S&P contract is the Standard and Poor's and the purpose is to show reverse correlation between the two instruments. Remember it's liken to a seesaw, when up goes up the other should go down and vice versa.
Yesterday the ZN made it's move at around 10 AM EST. The ZN hit a Low at around that time and the S&P moved Lower. If you look at the charts below ZN gave a signal at around 10 AM EST and the S&P moved Lower at around the same time. Look at the charts below and you'll see a pattern for both assets. ZN hit a Low at around 10 AM EST and the S&P was moving Lower shortly thereafter. These charts represent the newest version of MultiCharts and I've changed the timeframe to a 15 minute chart to display better. This represented a Long opportunity on the 10 year note, as a trader you could have netted about a dozen ticks per contract on this trade. Each tick is worth $15.625. Please note: the front month for the ZN is now Mar '21. The S&P contract is now March '21. I've changed the format to Renko bars such that it may be more apparent and visible.
Charts Courtesy of MultiCharts built on an AMP platform
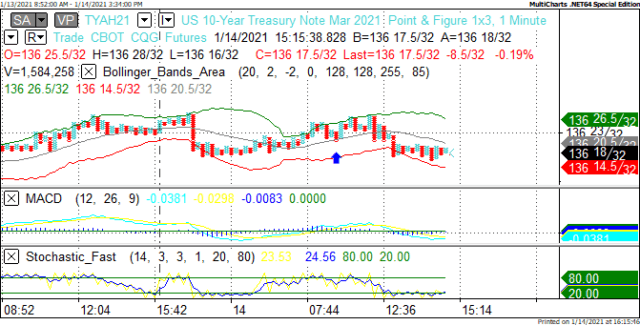
ZN - Mar 2021 - 1/14/21
-637463077051496155.png)
S&P - Mar 2021 - 1/14/21
Bias
Yesterday we gave the markets a Neutral bias as all instruments we use for market correlation purposes were trading Lower and this does not reflect a correlated market. The Dow dropped 69 points and the other indices lost ground as well. Today we aren't dealing with a correlated market and our bias is to the Downside.
Could this change? Of Course. Remember anything can happen in a volatile market.
Commentary
Well yesterday morning the S&P was Higher but we gave a Neutral bias because all the instruments we use to track market correlation was pointed Lower. Whenever there's a situation whereby all instruments are pointed either higher or lower, there is no market correlation and therefore we suggest a Neutral bias. Today we have a total of 10 economic reports, most of which are major so we have a mini tsunami in terms of eco news. President-elect Biden has given us a blueprint of what he'll do once he's sworn in as President. This is certainly better than finding out after the fact.
Author

Nick Mastrandrea
Market Tea Leaves


