Pre-market review: One day up, next day...[Video]
![Pre-market review: One day up, next day...[Video]](https://editorial.fxstreet.com/images/Markets/Currencies/Majors/DollarIndex/money-43062726_XtraLarge.jpg)
US Dollar: March USD is Up at 96.495.
Energies: April'20 Crude Down at 31.23.
Financials: The June'20 30 year bond is Up 84 ticks and trading at 183.05.
Indices: The March S&P 500 emini ES contract is 538 ticks Lower and trading at 2604.25.
Gold: The April '20 Gold contract is trading Up at 1644.30. Gold is 20 ticks Higher than its close.
Initial Conclusion
This is not a correlated market. The dollar is Up+ and Crude is Down- which is normal and the 30 year Bond is trading Higher. The Financials should always correlate with the US dollar such that if the dollar is lower then bonds should follow and vice-versa. The S&P is Lower and Crude is trading Lower which is not correlated. Gold is trading Higher which is not correlated with the US dollar trading Up. I tend to believe that Gold has an inverse relationship with the US Dollar as when the US Dollar is down, Gold tends to rise in value and vice-versa. Think of it as a seesaw, when one is up the other should be down. I point this out to you to make you aware that when we don't have a correlated market, it means something is wrong. As traders you need to be aware of this and proceed with your eyes wide open.
At this time all of Asia is trading Lower. Currently all of Europe is trading Lower as well.
Possible Challenges To Traders Today:
-
PPI is out at 8:30 AM EST. This is Major.
-
Core PPI is out at 8:30 AM EST. This is Major.
-
Unemployment Claims are out at 8:30 AM EST. This is Major.
-
Natural Gas Storage is out at 10:30 AM EST. This is Major.
-
30-y Bond Auction starts at 1 PM EST. This is Major.
Treasuries
We've elected to switch gears a bit and show correlation between the 30 year bond (ZB) and The S&P futures contract. The S&P contract is the Standard and Poor's and the purpose is to show reverse correlation between the two instruments. Remember it's liken to a seesaw, when up goes up the other should go down and vice versa.
Yesterday the ZB made a move at around 10:15 AM EST. The ZB hit a Low at around that time and the S&P moved Lower. If you look at the charts below ZB gave a signal at around 10:15 AM and the S&P moved Lower at the same time. Look at the charts below and you'll see a pattern for both assets. ZB hit a Low at around 10:15 AM EST and the S&P was moving Lower shortly thereafter. These charts represent the newest version of MultiCharts and I've changed the timeframe to a 15 minute chart to display better. This represented a Long opportunity on the 30 year bond, as a trader you could have netted 50 plus ticks per contract on this trade. Each tick is worth $31.25. Please note: the front month for the ZB is now June '20. The S&P contract is still March '20. I've changed the format to Renko bars such that it may be more apparent and visible.
Charts Courtesy of MultiCharts built on an AMP platform
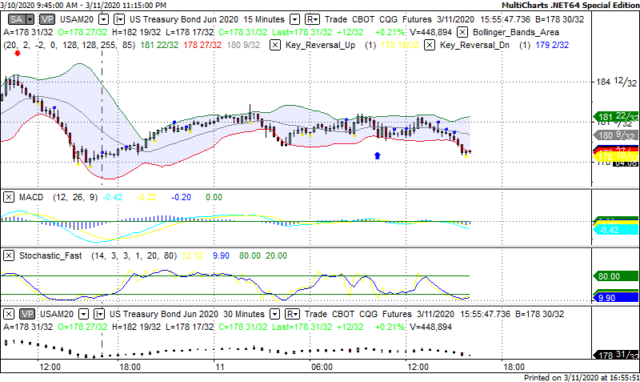
ZB - March, 2020 - 3/11/20
-637196051460130106.png)
SP March 2020 - 3/11/20
Bias
Yesterday we gave the markets a Neutral bias as we didn't see much in the way of correlation yesterday. The Dow dropped 1,465 points and the other indices lost ground as well. Today we aren't dealing with a correlated market and our bias is to the Downside.
Could this change? Of Course. Remember anything can happen in a volatile market.
Commentary
It would appear as though we're settling into this pattern of one day up, next day down. The danger with that is thinking that you can predict market direction without doing any of the analysis or fundamentals and then one day you think the market will rise because the previous day it faltered. And then guess what?, it rises again and you lose your shirt. We take each day as it comes and never pre judge the markets as each day will provide new opportunities for gain and growth as well as a considerable drop in market value. Today we have PPI, Core PPI, Unemployment Claims and the 30 year Bond Auction at 1 PM EST. All of these are major. Will they be enough to raise the markets? Only time will tell....
Author

Nick Mastrandrea
Market Tea Leaves


