PPI data: October's minimal rise, Fed's rate hike uncertainty
USD: Dec '23 is Up at 104.355.
Energies: Jan '24 Crude is Down at 76.37.
Financials: The Dec '23 30 Year T-Bond is Up 16 ticks and trading at 114.24.
Indices: The Dec '23 S&P 500 emini ES contract is 31 ticks Lower and trading at 4511.50
Gold: The Dec'23 Gold contract is trading Up at 1966.00.
Initial conclusion
This is not a correlated market. The USD is Up and Crude is Down which is normal, and the 30 Year T-Bond is trading Higher. The Financials should always correlate with the US dollar such that if the dollar is Higher, then the bonds should follow and vice-versa. The S&P is Lower and Crude is trading Lower which is correlated. Gold is trading Higher which is not correlated with the US dollar trading Up. I tend to believe that Gold has an inverse relationship with the US Dollar as when the US Dollar is down, Gold tends to rise in value and vice-versa. Think of it as a seesaw, when one is up the other should be down. I point this out to you to make you aware that when we don't have a correlated market, it means something is wrong. As traders you need to be aware of this and proceed with your eyes wide open. All of Asia is trading Mixed. Europe is trading Mixed as well.
Possible challenges to traders
-
Unemployment Claims are out at 8:30 AM EST. This is Major.
-
Philly Fed Manufacturing Index is out at 8:30 AM EST. This is Major.
-
Import Prices m/m is out at 8:30 AM EST. This is Major.
-
Industrial Production m/m is out at 9:15 AM EST. This is Major.
-
Capacity Utilization Rate is out at 9:15 AM EST. This is Major.
-
FOMC Member Williams Speaks at 9:25 AM EST. This is Major.
-
NAHB Housing Market Index is out at 10 AM EST. This is Major.
-
FOMC Member Waller Speaks at 10:30 AM. This is Major.
-
Natural Gas Storage is out at 10:30 AM EST. This is Major.
-
FOMC Member Barr Speaks at 10:35 AM EST. This is Major.
Treasuries
Traders, please note that we've changed the Bond instrument from the 30 year (ZB) to the 10 year (ZN). They work exactly the same.
We've elected to switch gears a bit and show correlation between the 10-year bond (ZN) and the S&P futures contract. The S&P contract is the Standard and Poor's, and the purpose is to show reverse correlation between the two instruments. Remember it's likened to a seesaw, when up goes up the other should go down and vice versa. Today we aren't dealing with a correlated market and our bias is to the Upside.
Yesterday the ZN migrated Higher at around 8:30 AM EST as the S&P hit a Low at around the same time. If you look at the charts below the S&P gave a signal at around 8:30 AM and the ZN started its Downward trend. Look at the charts below and you'll see a pattern for both assets. S&P hit a Low at around 8:30 AM and migrated Higher. These charts represent the newest version of MultiCharts and I've changed the timeframe to a 15-minute chart to display better. This represented a Short opportunity on the 10-year note, as a trader you could have netted about 30 ticks per contract on this trade. Each tick is worth $15.625. Please note: the front month for the ZN is now Dec '23. The S&P contract is now Dec' 23. I've changed the format to filled Candlesticks (not hollow) such that it may be more apparent and visible.
Charts courtesy of MultiCharts built on an AMP platform
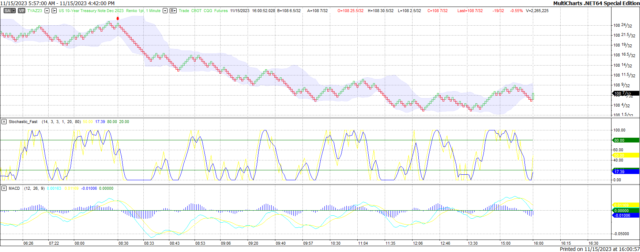
ZN - Dec 2023 - 11/15/23
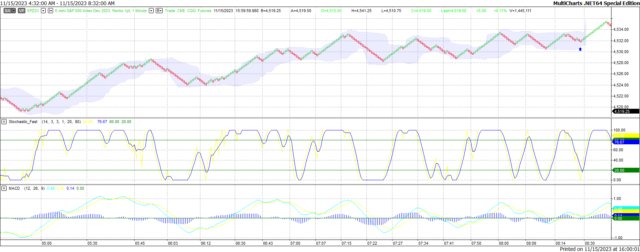
S&P - Dec 2023 - 11/15/23
Bias
Yesterday we gave the markets an Upside bias as both the Bonds and Crude were trading Lower and that usually reflects an Upside Day. The indices didn't disappoint as the Dow closed Higher by 164 points and the other indices closed Higher as well. Today we aren't dealing with a correlated market and our bias is to the Downside.
Could this change? Of Course. Remember anything can happen in a volatile market.
Commentary
Yesterday the PPI data was released at 8:30 AM EST and it seems that supplier prices didn't rise much in October as well, in fact it was reported that yesterday report showed the lowest increase since March, 2020 before the pandemic took off. The Federal Reserve will also take these numbers into consideration next month when they decide if whether or not to hike interest rates. Personally I can't see how they can justify a rate increase when both Consumer and Producer prices haven't increased much but as in all things only time will tell...
Author

Nick Mastrandrea
Market Tea Leaves


