Powell has laid out the map but will he follow it?

Traders have had a weekend to think about the chaos.
Last week was a lot to handle in many regards. Perhaps the most reliable clue we were offered was the Federal Open Market Committee roadmap to interest rate hikes. Despite the effort that has been put into the dot plot, we cannot overlook the wording that came along with it. In essence, the plan to raise rates a quarter of a point at each of this year's meetings is simply a guideline. If inflation persists, they will do more but if inflation rolls over they will do less.
Today, the Treasury market priced in a little more than the dot plot. But we can't help but feel like it is getting ahead of itself. To be fair, we thought that last week but yields have continued to melt higher. Nevertheless, peaks in inflation have been historically quick and volatile. In other words, things can turn on a dime and the year is young. It's only March! We could be nearing capitulation inflation...
Treasury Futures Markets
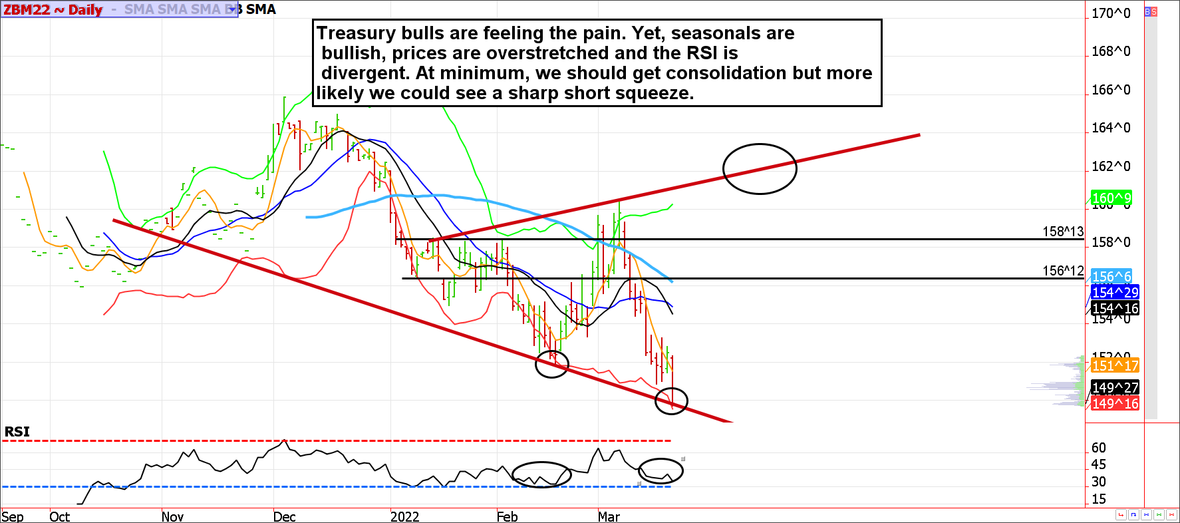
30-year Treasury Bond Futures
Speculators are extremely short in 10-year note futures.
According to the latest COT Report issued by the CFTC, large speculators are holding a net short position of about 370,000 contracts as of last Tuesday. Judging by the bloodbath that has taken place since the market is even shorter now. We haven't seen speculators this short since the middle of 2019. There was a similar net short position in early 2020 prior to the Covid crisis. In both scenarios, Treasuries moved substantially higher as the short position unwound itself. Eventually, we will likely see a similar rally.
Another thing to keep in mind as we watch Treasuries fall into the abyss. Tomorrow is the last trading day for the March contract. When trends are entrenched, we often see large spikes in the direction of a trend as the front-month contract drops off the board followed by a reversal. Look for such a reversal in the coming days as the long squeeze turns into a short squeeze (hopefully).
Treasury futures market consensus:
Was today the capitulation? It is hard to believe there are many bulls left. We can't rule out a probe to 149'0 in the 30-year and 122'15 in the 10-year note, but the best trades are likely from the long side.
Technical Support: ZB: 149'0 ZN: 123'02 and 122'15
Technical Resistance: ZB: 153'08, 156'01, 158'09, and 160'12 ZN: 125'15, 127'10 and 128;21.
Stock Index Futures
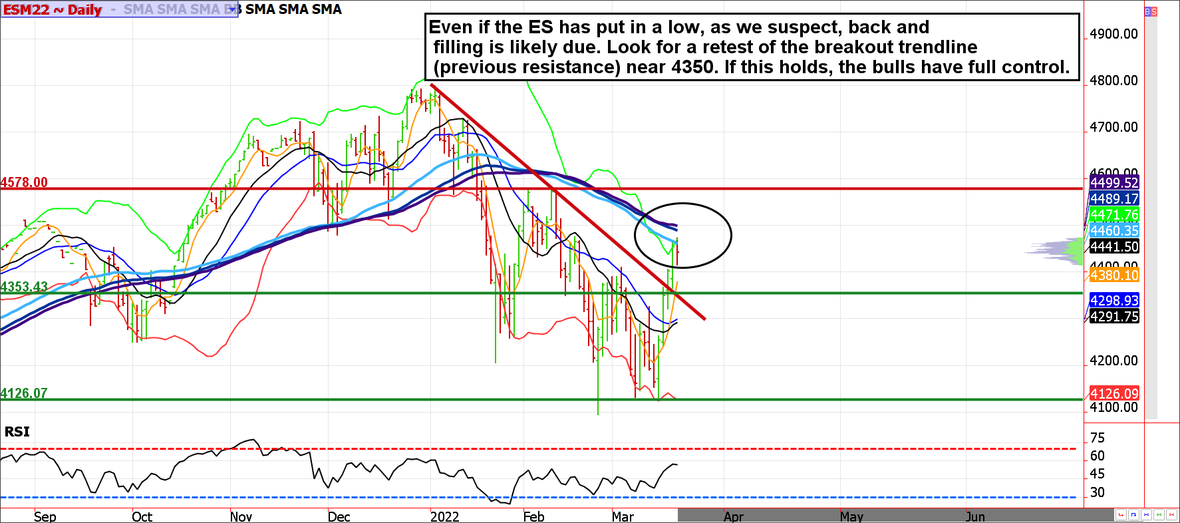
The ES is attempting a breakout.
A break above 4340 last week was a bullish sign of things to come. However, breakouts rarely move in the initial direction without shaking out traders. We suspect the ES will come back to touch the previous downtrend line which will now act as support (around 4350). If you are a bull, this might be a good place to consider dipping a toe in the water. If you are a bear, you will want to see prices melt through 4350 and fall back into the previous trading wedge. For now, I am leaning toward this being a bonafide breakout. The VIX term structure is bullish, the chart suggests a solid base is forming, and seasonals turn bullish next week.
Stock index futures market consensus:
We suspect a test of 4350 could be in the works, but as long as that level holds the bulls are in control.
Technical Support: 4350, 4125 and 4000
Technical Resistance: 4490, 4590, 4650, 4750, 4808, 4875 and 4925
E-mini S&P Futures Day Trading Levels
These are counter-trend entry ideas, the more distant the level the more reliable but the less likely to get filled
ES Day Trade Sell Levels: 4490, 4575 and 4615
ES Day Trade Buy Levels: 4350, 4140 and 4000
In other commodity futures and options markets...
October 20 - Buy December 2022 (not 21) $7.00 corn calls near 12 cents.
December 9 - Bull call spread with naked legs in wheat (buy March 8 call, sell the 8.50 and sell a 7.30 put).
January 7 - Aggressive call option spreads in gold.
January 10 - Aggressive call option spreads in silver.
January 11 - May coffee ladders (buy May 240 call, sell 260 call and sell the 280 call).
January 13 - May Corn bull call spreads with a naked leg (buy the May 6.50 call, sell the 6.00 call and then sell the 5.50 put).
January 19 - May crude oil ladders (buy the May 85.00 call, sell the May 92.00 call and sell the May 97.00 call) for about 70 cents ($700).
January 20 - May silver call ladders (buy the 25.00 sell the 26.50 and sell the 28.50) for about 5 cents or $250.
January 25 - May wheat call ladders (buy the 8.20 call, sell the 9.00 and the 9.50 calls) for a net cost of about 7 cents.
February 1 - May soybean call ladder (buy the 15.50 call, sell the 16.30 call and then sell the 17.00 call) for about 5 cents.
February 4 - Risk reversals in the May 10-year note (buy May 128.5 call and sell the May 125 put)
February 8 - Bear put spreads with a naked call in April hogs (Buy the 100 put, sell the 92 put and sell the 110 call for a small credit).
February 14 - Gold call ladders, buy the April 1875 call, sell the 1925 call and the 1950 call.
February 17 - Buy April Sugar 17.75 call.
February 17 - Another gold ladder, this time buy the May 1925 call, sell the May 2000 call, and the 2050 call.
Due to time constraints and our fiduciary duty to put clients first, the charts provided in this newsletter may not reflect the current session data.
Seasonality is already factored into current prices, any references to such does not indicate future market action.
**There is substantial risk of loss in trading futures and options.** These recommendations are a solicitation for entering into derivatives transactions. All known news and events have already been factored into the price of the underlying derivatives discussed. From time to time persons affiliated with Zaner, or its associated companies, may have positions in recommended and other derivatives. Past performance is not indicative of future results. The information and data in this report were obtained from sources considered reliable. Their accuracy or completeness is not guaranteed. Any decision to purchase or sell as a result of the opinions expressed in this report will be the full responsibility of the person authorizing such transaction. Seasonal tendencies are a composite of some of the more consistent commodity futures seasonals that have occurred over the past 15 or more years. There are usually underlying, fundamental circumstances that occur annually that tend to cause the futures markets to react in similar directional manner during a certain calendar year. While seasonal trends may potentially impact supply and demand in certain commodities, seasonal aspects of supply and demand have been factored into futures & options market pricing. Even if a seasonal tendency occurs in the future, it may not result in a profitable transaction as fees and the timing of the entry and liquidation may impact on the results. No representation is being made that any account has in the past, or will in the future, achieve profits using these recommendations. No representation is being made that price patterns will recur in the future.
Author

Carley Garner
DeCarley Trading
Carley Garner is an experienced commodity broker with DeCarley Trading, a division of Zaner, in Las Vegas, Nevada. She is also the author of multiple books including, “Higher Probability Commodity Trading” and “A Trader's First Book on Commodities”.


