Post holiday starts with a bang [Video]
![Post holiday starts with a bang [Video]](https://editorial.fxstreet.com/images/Markets/Currencies/Majors/DollarIndex/portraits-of-u-s-presidents-on-dollar-bills-gm465128326-59608952_XtraLarge.jpg)
US Dollar: Sept USD is Up at 97.080.
Energies: Aug'20 Crude is Down at 40.07.
Financials: The Sept'20 30 year bond is Up 17 ticks and trading at 178.16.
Indices: The Sept S&P 500 emini ES contract is 114 ticks Lower and trading at 3143.50.
Gold: The Aug'20 Gold contract is trading Down at 1784.60. Gold is 90 ticks Lower than its close.
Initial Conclusion
This is not a correlated market. The dollar is Up+ and Crude is Down- which is normal and the 30 year Bond is trading Higher as well. The Financials should always correlate with the US dollar such that if the dollar is lower then bonds should follow and vice-versa. The S&P is Lower and Crude is trading Lower which is not correlated. Gold is trading Lower which is correlated with the US dollar trading Up. I tend to believe that Gold has an inverse relationship with the US Dollar as when the US Dollar is down, Gold tends to rise in value and vice-versa. Think of it as a seesaw, when one is up the other should be down. I point this out to you to make you aware that when we don't have a correlated market, it means something is wrong. As traders you need to be aware of this and proceed with your eyes wide open.
At this time Asia is trading mainly Lower with the exception of the Shanghai and Sensex exchanges which are Higher at this time. Currently all of Europe is trading to the Downside.
Possible Challenges To Traders Today:
-
IBD/TIPP Economic Optimism is out at 10 AM EST. This is Major.
-
Jolts Job Openings is out at 10 AM EST. This is Major.
-
FOMC Member Quarles Speaks at 1 PM EST. This is Major.
Treasuries
We've elected to switch gears a bit and show correlation between the 30 year bond (ZB) and The S&P futures contract. The S&P contract is the Standard and Poor's and the purpose is to show reverse correlation between the two instruments. Remember it's liken to a seesaw, when up goes up the other should go down and vice versa.
Yesterday the ZB made it's move at around 9:15 AM EST. The ZB hit a Low at around that time and the S&P moved Lower. If you look at the charts below ZB gave a signal at around 9:15 AM EST and the S&P moved Lower at around the same time. Look at the charts below and you'll see a pattern for both assets. ZB hit a Low at around 9:15 AM EST and the S&P was moving Lower shortly thereafter. These charts represent the newest version of MultiCharts and I've changed the timeframe to a 15 minute chart to display better. This represented a Long opportunity on the 30 year bond, as a trader you could have netted about 20 plus ticks per contract on this trade. Each tick is worth $31.25. Please note: the front month for the ZB is now Sept '20. The S&P contract has been changed to Sept '20. I've changed the format to Renko bars such that it may be more apparent and visible.
Charts Courtesy of MultiCharts built on an AMP platform
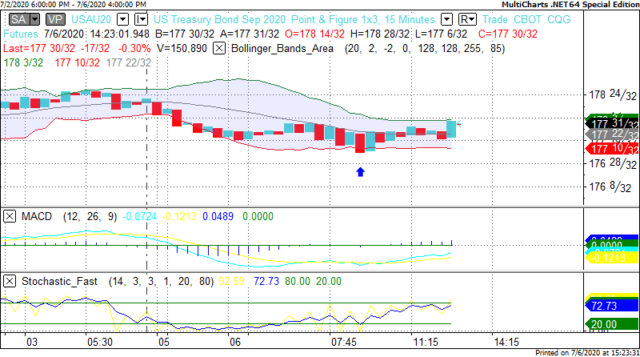
ZB - Sept 2020 - 7/6/20
-637297132564122953.png)
SP - Sept 2020 - 7/6/20
Bias
Yesterday we gave the markets an Upside bias as Gold, the Bonds and USD were all trading Lower yesterday morning and this is usually a good indication for an Upside day. The markets didn't disappoint as the Dow gained 460 points and the other indices gained ground as well. Today we aren't dealing with a correlated market and our bias is to the Downside.
Could this change? Of Course. Remember anything can happen in a volatile market.
Commentary
Yesterday we woke to a pleasant surprise as all of Asia and Europe were trading to the Upside. The US markets followed that path as the Americans wanted to further capitalize on the "good" jobs numbers posted on Thursday. That plus historically speaking the markets gravitate to the upside after a 3 day holiday weekend. Usually but not always. There are time when it can gravitate to the Downside as well. Could it be that the Smart Money wanted to get into the act today? That's is very possible as usually they head out early on a 3 day holiday weekend. Today we have Jolts Job Openings which can serve to give better clarity on the job situation in the US economy.
Author

Nick Mastrandrea
Market Tea Leaves


