Point and figure target for a small distribution range — S&P 500 day trading [Video]
![Point and figure target for a small distribution range — S&P 500 day trading [Video]](https://editorial.fxstreet.com/images/Markets/Equities/SP500/wall_street_nyse2-637299021353183737.jpg)
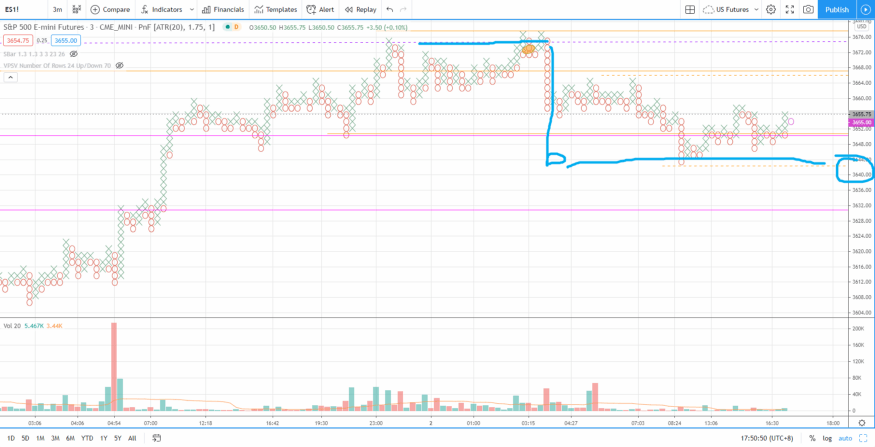
Find out how to project a downside target from a distribution range in a 3-minutes timeframe with Point & Figure (P&F) projection.
Check out the video for a complete walk through of the daily market analysis of S&P 500 futures (ES) for 2 Dec 2020 trading session. In this video, you will find out the market recap during the last session and a trade review in the three-minutes timeframe (including entry, exit and the rationale behind). Going forward, I will cover the bias, the key levels to pay attention to, my trading plan for the session later.
Watch my daily market analysis video in the last session if you haven’t in order to better relate to the market recap and the trade review.
Bias — neutral (Day trading); bullish (long term).
Key levels — Resistance: 3670; Support: 3630-3640, 3600, 3587.
Potential setup — Look for potential reversal at the key levels.
Author

Ming Jong Tey
Independent Analyst
Ming Jong Tey has been trading since 2008. He started his learning journey from technical analysis (indicators, Fibonacci, etc...) to value investing. Throughout his journey, he develops an interest in price action with chart pattern trading.


