Pleading the Fifth
Conflicting signals and information
Having read a ton of analysis of the ceasefire, I can confidently say that I have no idea what is going on. The U.S. and Iran are singing completely different tunes and so the skeptics remain skeptical, and the optimists say the conflict is over. For me, like I said yesterday: Too hard. While my job is supposed to be to forecast markets, I would rather plead the fifth right now and wait for a narrative regime I understand better.
All that said, the USD move is easy to understand given the amount of hedging that has gone through since early March, and the lack of real USD buyers once the corporate and real money month-end flows finished at the end of March. The only people that have been buying dollars are the ones who are forced to do so. As discussed yesterday, the market is long USD and bearish USD at the same time.
The vibes and price action this year are similar to how they felt this time last year. While the magnitude of the drop on Liberation Day was larger than the one preceding Ultimatum Day, the “escalate to deescalate and then declare victory” framework mirrors well. The chart also stacks up similarly.
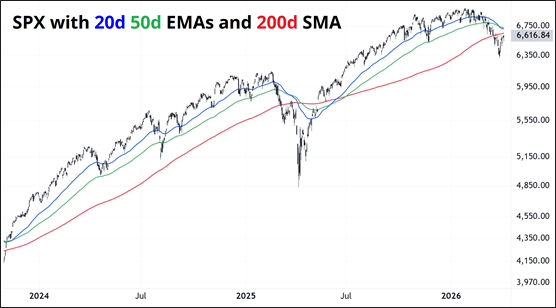
After the 90-day pause on tariffs in April 2025, the S&P rallied back to the 20- and 50-day moving averages (blue and green). Then, it consolidated for a week or so before gapping up through the 200-day (red) and never looking back.
For the sake of maintaining sanity, it makes sense for bears to give up above 6750 in SPX. Having a clear reassessment trigger like this is useful as it gives you a mental offramp from a stale view, even if you can’t give up the view itself. Given the “too hard” nature of trying to forecast what seemed like a coin flip binary event yesterday, I ended the day flat in equity land and I am still flat. I am agnostic on stocks here for now and hope to gain some clarity at some point soon.
Unforecastable
FX trading during the war that may or may not have ended last night is a great reminder of how the old correlations are dead. This grid shows currency performance from 27FEB26 (before the war) to yesterday’s close. The moves are normalized by average day’s range. So, if average day range is 80 pips and it’s moved 400 pips, that’s 5.0.
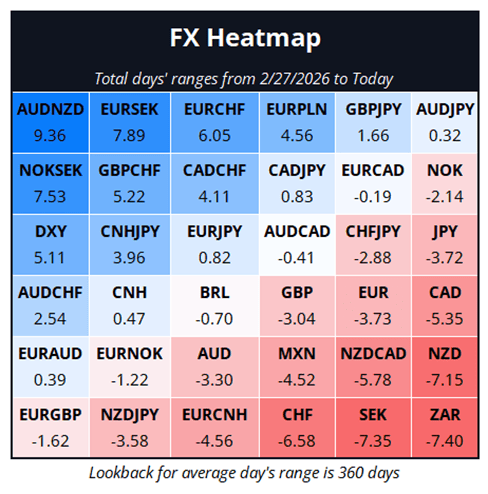
If, on 27FEB, I gave you all the WSJ and FT and NYT front pages from 28FEB to today and said you could put on three currency trades. Would long USDCAD and long GBPCHF and long EURCHF have been choices you might have considered? No.
Perhaps the most remarkable (and disappointing) aspect of the grid is just how little FX has moved in the past six weeks. If you scan the middle of that grid, you can see many important pairs like EURAUD, cross/JPY, EURNOK, GBPUSD, and CNH all virtually unchanged.
The CHF move is particularly weird, though even ex-ante we kind of knew CHF wasn’t a safe haven anymore, especially not when EURCHF is trading at the all-time lows near a massive round number and the SNB is chirping. So, it’s not a huge surprise that EURCHF didn’t go down—but it’s odd that it ripped. This is consistent with the behavior of gold. Instead of working as a safe haven, gold has become more of a risky asset as speculators have become the marginal buyer (and seller) of metals.
CNH
Simon Flint, our practical, market-driven EMFX Strategist, monitors the CNY fix closely because that’s the best way to gauge the PBoC’s true policy preference. He had some interesting stats on how the fix is predictive of future movement in USDCNH and I thought I would share. Everything on the next page was authored by Simon Flint. Then I reappear on page 4.
“Q: Is Estimating the USD/CNY Fix Worth the Effort?” (A: Yes).
Many—some very seasoned, very profitable CNH traders included—throw their hands up at the morning fix and mutter about randomness. However, the “errors” versus a clean, modelled fix aren’t noise—they’re signal.
That was especially obvious from December to February, when we saw ten fixings more than one standard deviation below (my rough) model. This was in tune with the remarkably orderly grind lower in USD/CNH.
But was this just a one-off? Apparently not. Across a sample taken since 2025, weaker-than-expected fixes were generally followed by CNH-NEER strength. The rightmost column in the table below tells the story: once you get to a -2σ fix, average CNH-NEER appreciation over the next month is about 0.5%, versus a pedestrian 0.06% across the full series (full series σ ≈ 0.98%).
TABLE 1
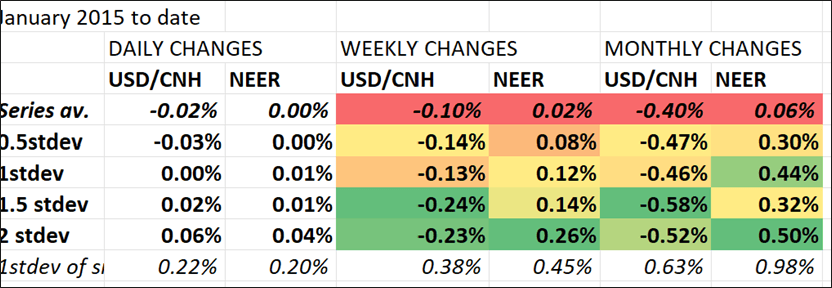
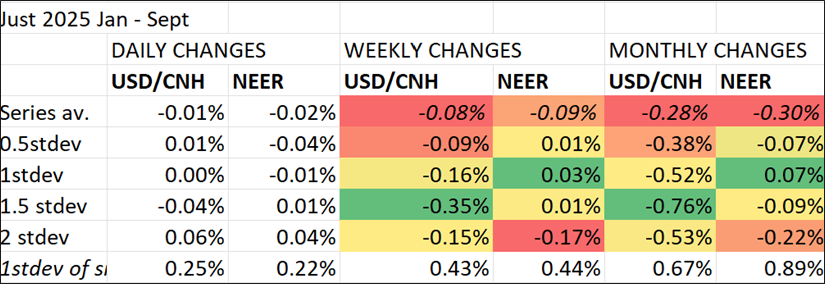
Worried this is just the post-October 2025 CNH rally doing the heavy lifting? Nope. Look at Jan–Sept 2025. The signal shows up cleanly in USD/CNH: at -1.5σ or lower, the pair falls ~0.76% over the next month, versus a -0.28% average.
TABLE 2
But there’s no data-mining—just a rough model, now improved, doing its job fairly well.
Author

Brent Donnelly
Spectra Markets
Brent Donnelly is the President of Spectra Markets. He has been trading currencies since 1995 and writing about macro since 2004. Brent is the author of “Alpha Trader” (2021) and “The Art of Currency Trading” (Wiley, 2019).


